
Entra · Secure Score · Security
Microsoft Secure Score Series – 10 – Discover trends in shadow IT application usage
On this page
In this series, I’ll be covering the Microsoft Secure Score improvement actions. Although Microsoft does a great job on telling you what to do, some actions have a much bigger impact and need to be balanced against business needs. Some actions might not even have value for your organization. In the end, Microsoft Secure Score is meant to strengthen your security, not a contest to reach the highest score possible. In this series, I’ll pick out random actions and try to make it as simple as possible, backed with notes from the field.
Articles in this series can be read separately since they are written at random order. The articles vary in case of impact and complexity and cover multiple categories. Here is a list of all the articles in this series:
01 - What is Microsoft Secure Score?
02 – Require MFA for administrative roles
03 – Enable Password Hash Sync if hybrid
04 – Ensure all users can complete multi-factor authentication for secure access
05 – Enable self-service password reset
06 – Enable policy to block legacy authentication
07 – Turn on sign-in risk policy
08 – Use Cloud App Security to detect anomalous behavior
09 – Do not allow users to grant consent to unmanaged applications
10 – Discover trends in shadow IT application usage
12 – Turn on customer lockbox feature
13 – Set automated notifications for new and trending cloud applications in your organization
14 – Designate more than one global admin
10 - Discover trends in shadow IT application usage#
Add a data source in automatic log upload for Cloud App Security Discovery to identify applications in your organization that run without official approval. After configuration, Cloud App Security Discovery will analyze firewall traffic logs to provide visibility into cloud applications’ usage and security posture.
Today, we take a look at Cloud Discovery. With Cloud Discovery you can analyze your firewall and proxies log files, to track down shadow IT and determine the risk that is coming with the use of those applications. The logs are held against a large database of applications and ranked by over 80 risk factors. This can be done manually (Snapshot reports) by uploading your logs, or ongoing (Continuous reports) by forwarding your log files to Cloud App Security.
Cloud App Security can also integrate with Microsoft Defender ATP and you can setup Log collectors to automatically upload your data, using Syslog or FTP. Take a look at all the firewalls and proxies that are supported. Some vendors have native integration with Cloud App Security.
When your firewall or proxy is not listed, you can still use the custom log parser to parse your data or send the log files to Microsoft. Microsoft will then review that data and see if they can add support for that specific log type.
License#
The Microsoft Cloud App Discovery feature is included in various licensing options. If you have any of the below licenses, they will be able to access the Discovery capabilities within Microsoft Cloud App Security:
- Microsoft Cloud App Security
- Azure Active Directory P1
- Enterprise Mobility + Security E3, which includes AAD P1 license
- Office 365 E5
If you own an Office 365 Cloud App Security license, you can use Cloud App Discovery, but with fewer capabilities. You can only upload log files manually, your data cannot be anonymized and the feature will only focus on apps that are equivalent to Office 365.
For more information take a look at this guide and this article.
Create a snapshot report#
Before you configure Continous reports, it is important to manually upload your log files first. This way, you can check if the data is parsed correctly. In this example, I use the sample data from a Cisco IronPort WSA appliance.
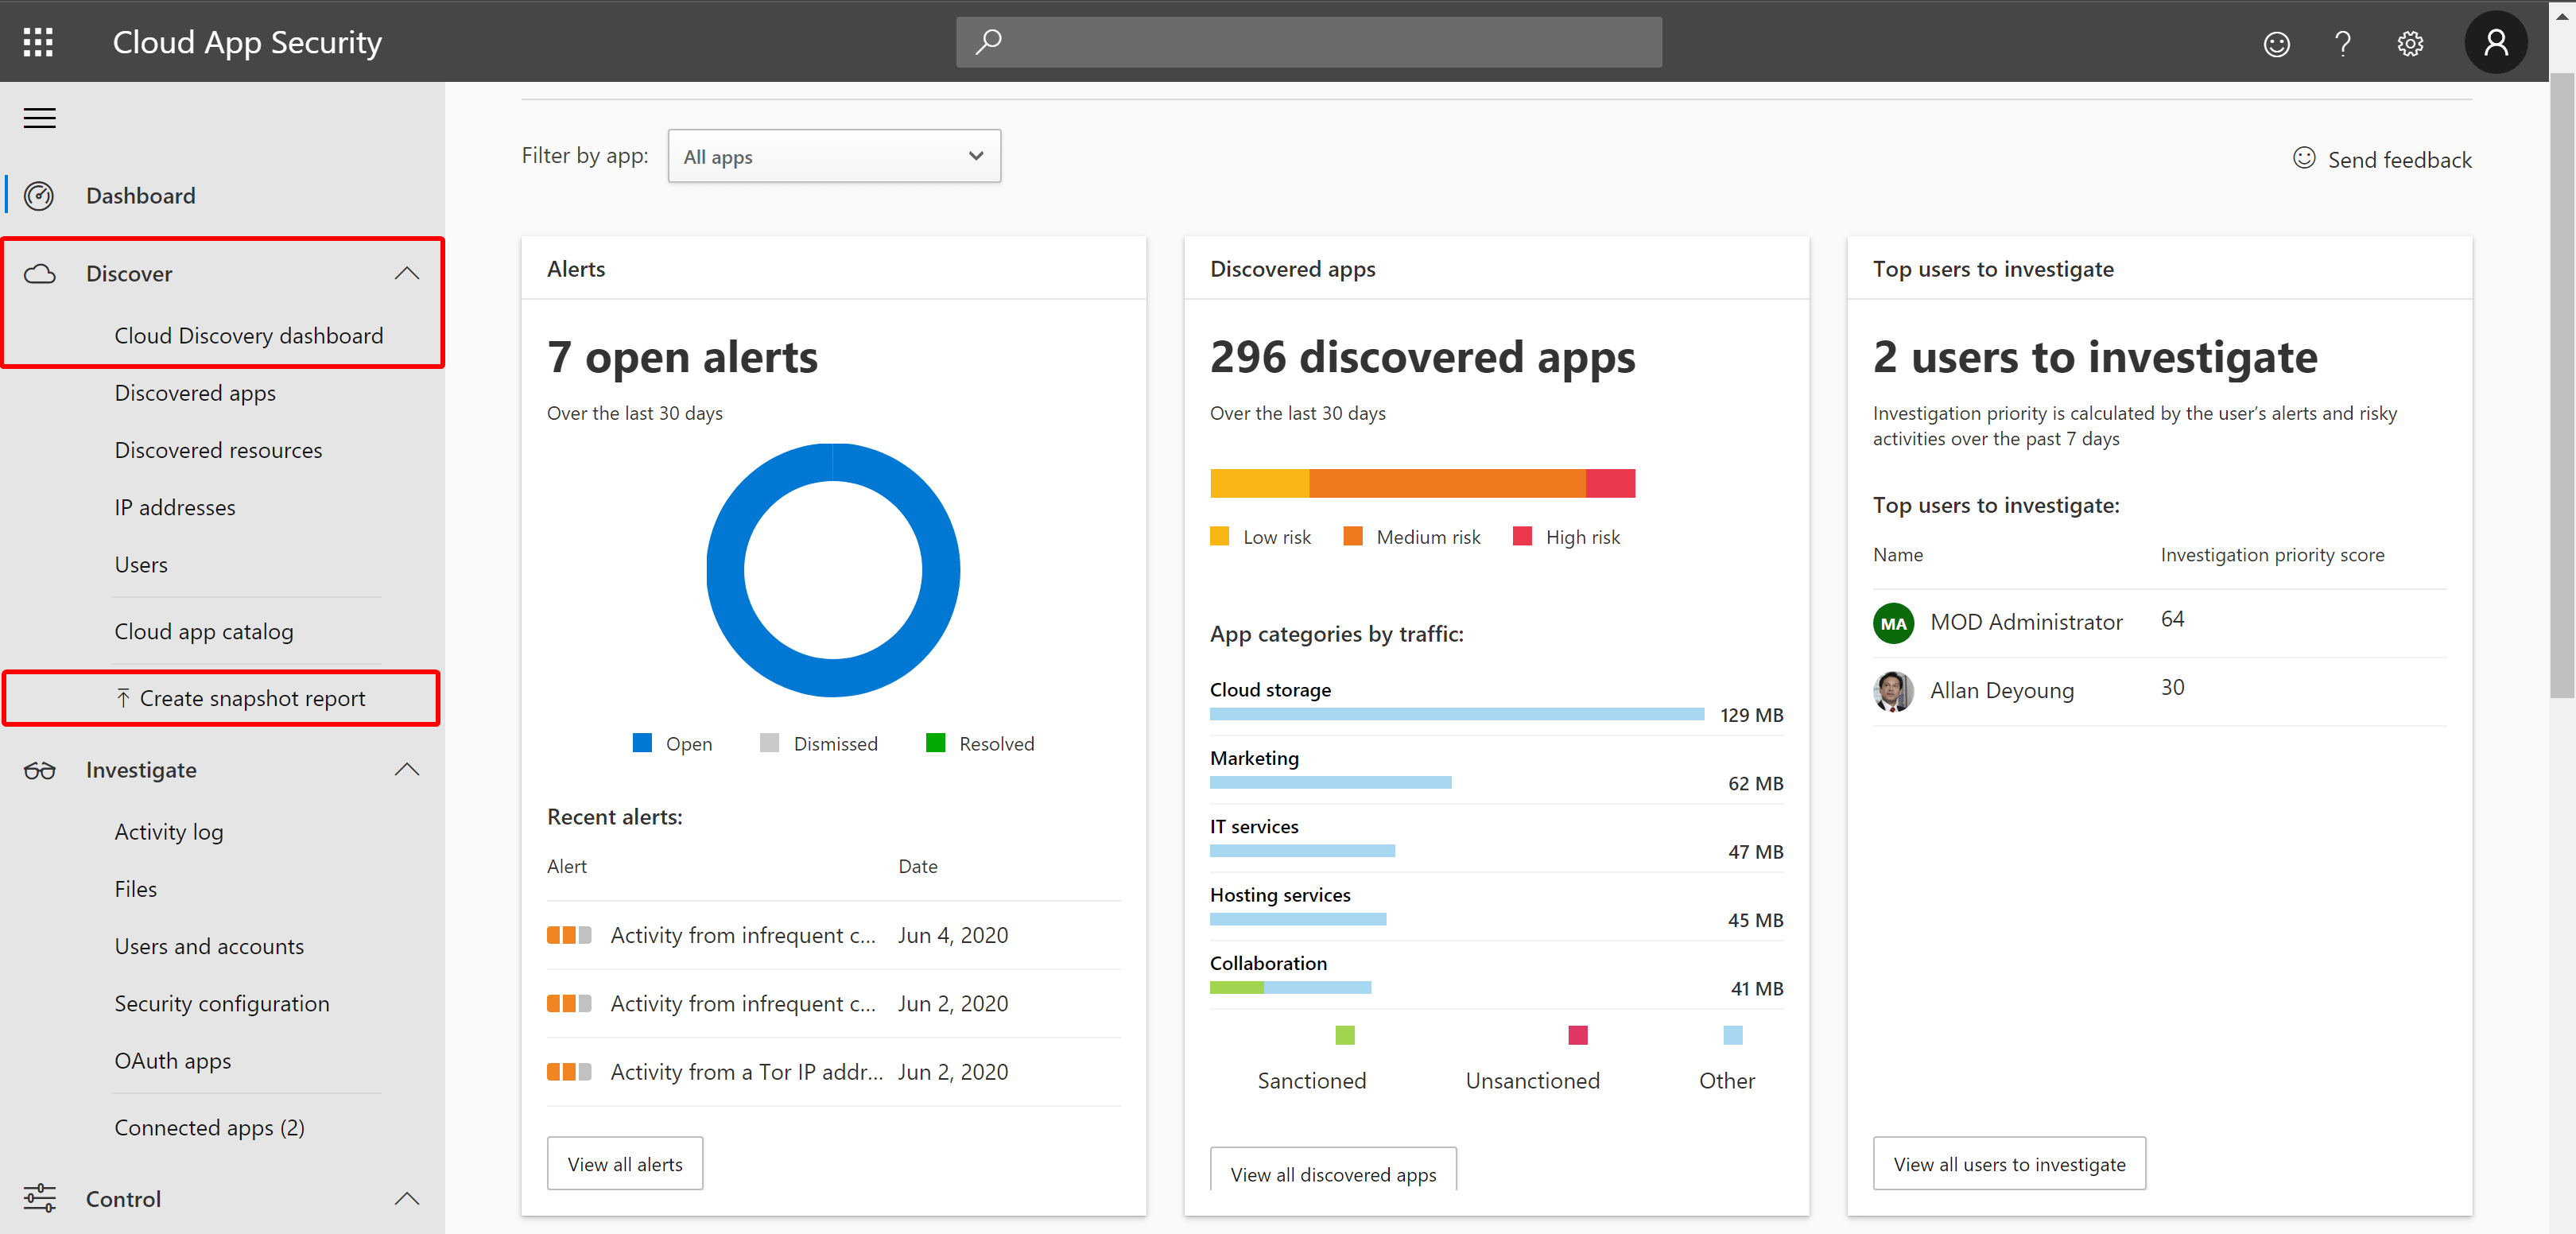
Head over to your Cloud App Security portal. The easiest way to that is by using this short link: https://aka.ms/mcasportal Go to Discover -> Create snapshot report
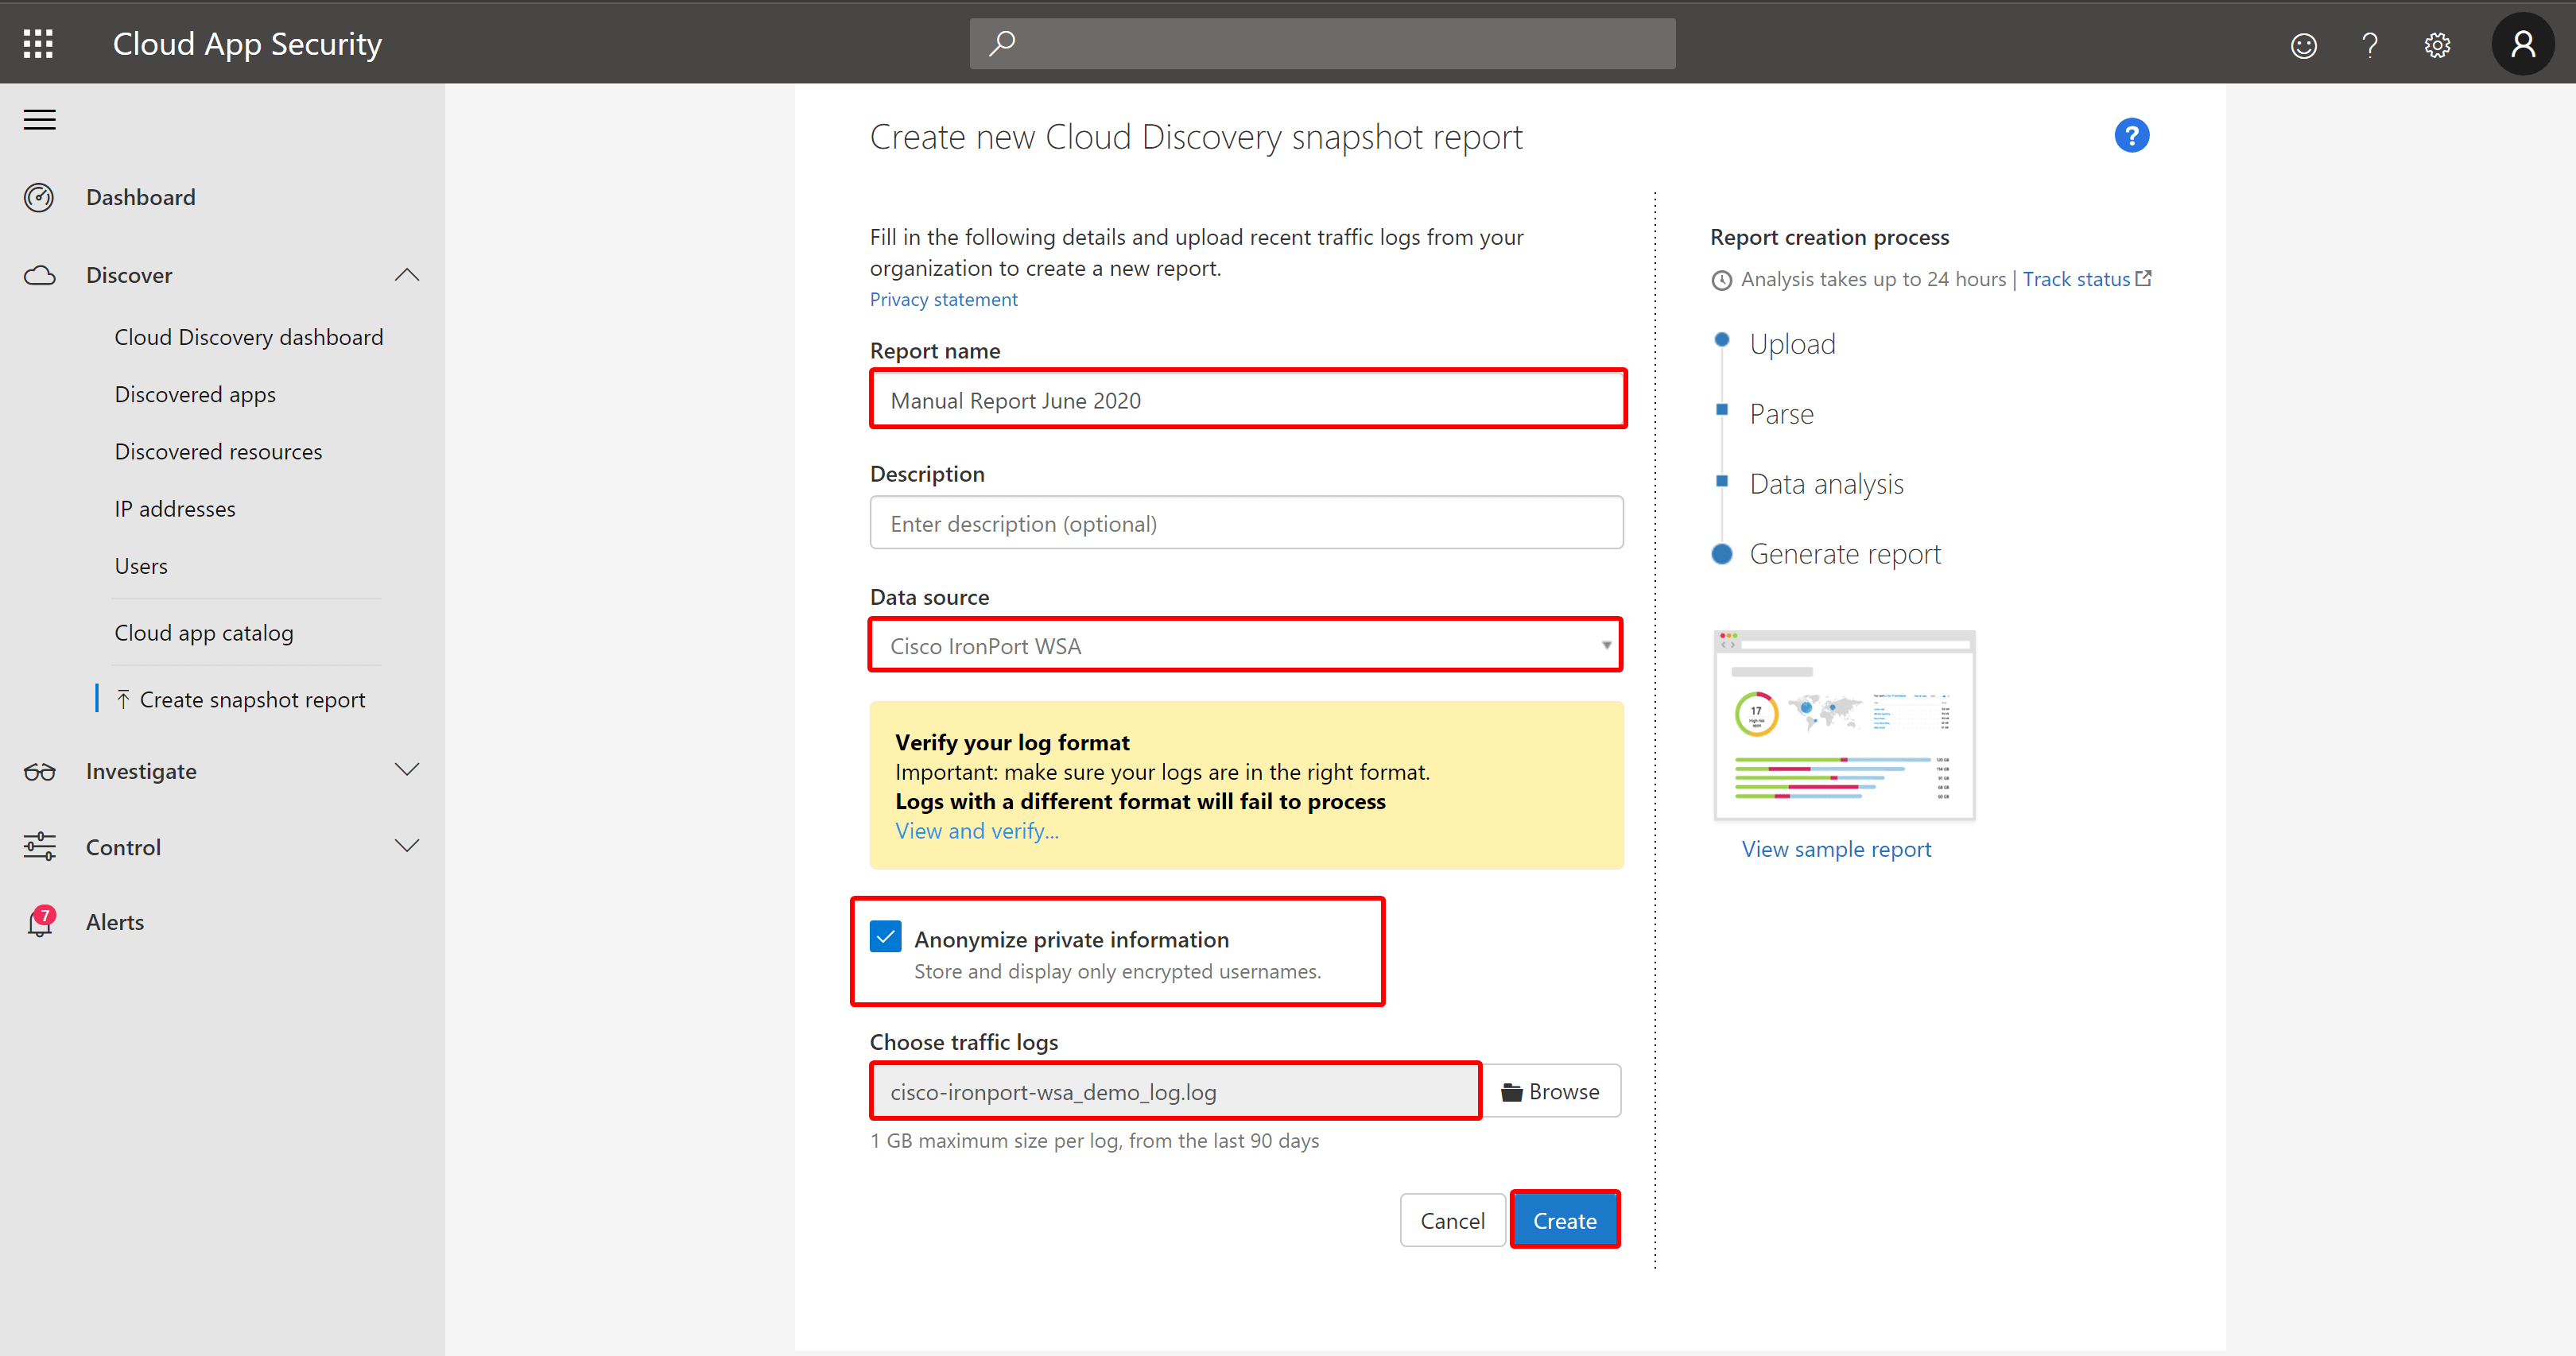
Enter a name and select the right data source. You can download a sample file to check whether your log file corresponds with the sample data. Optional, you can anonymize the data.
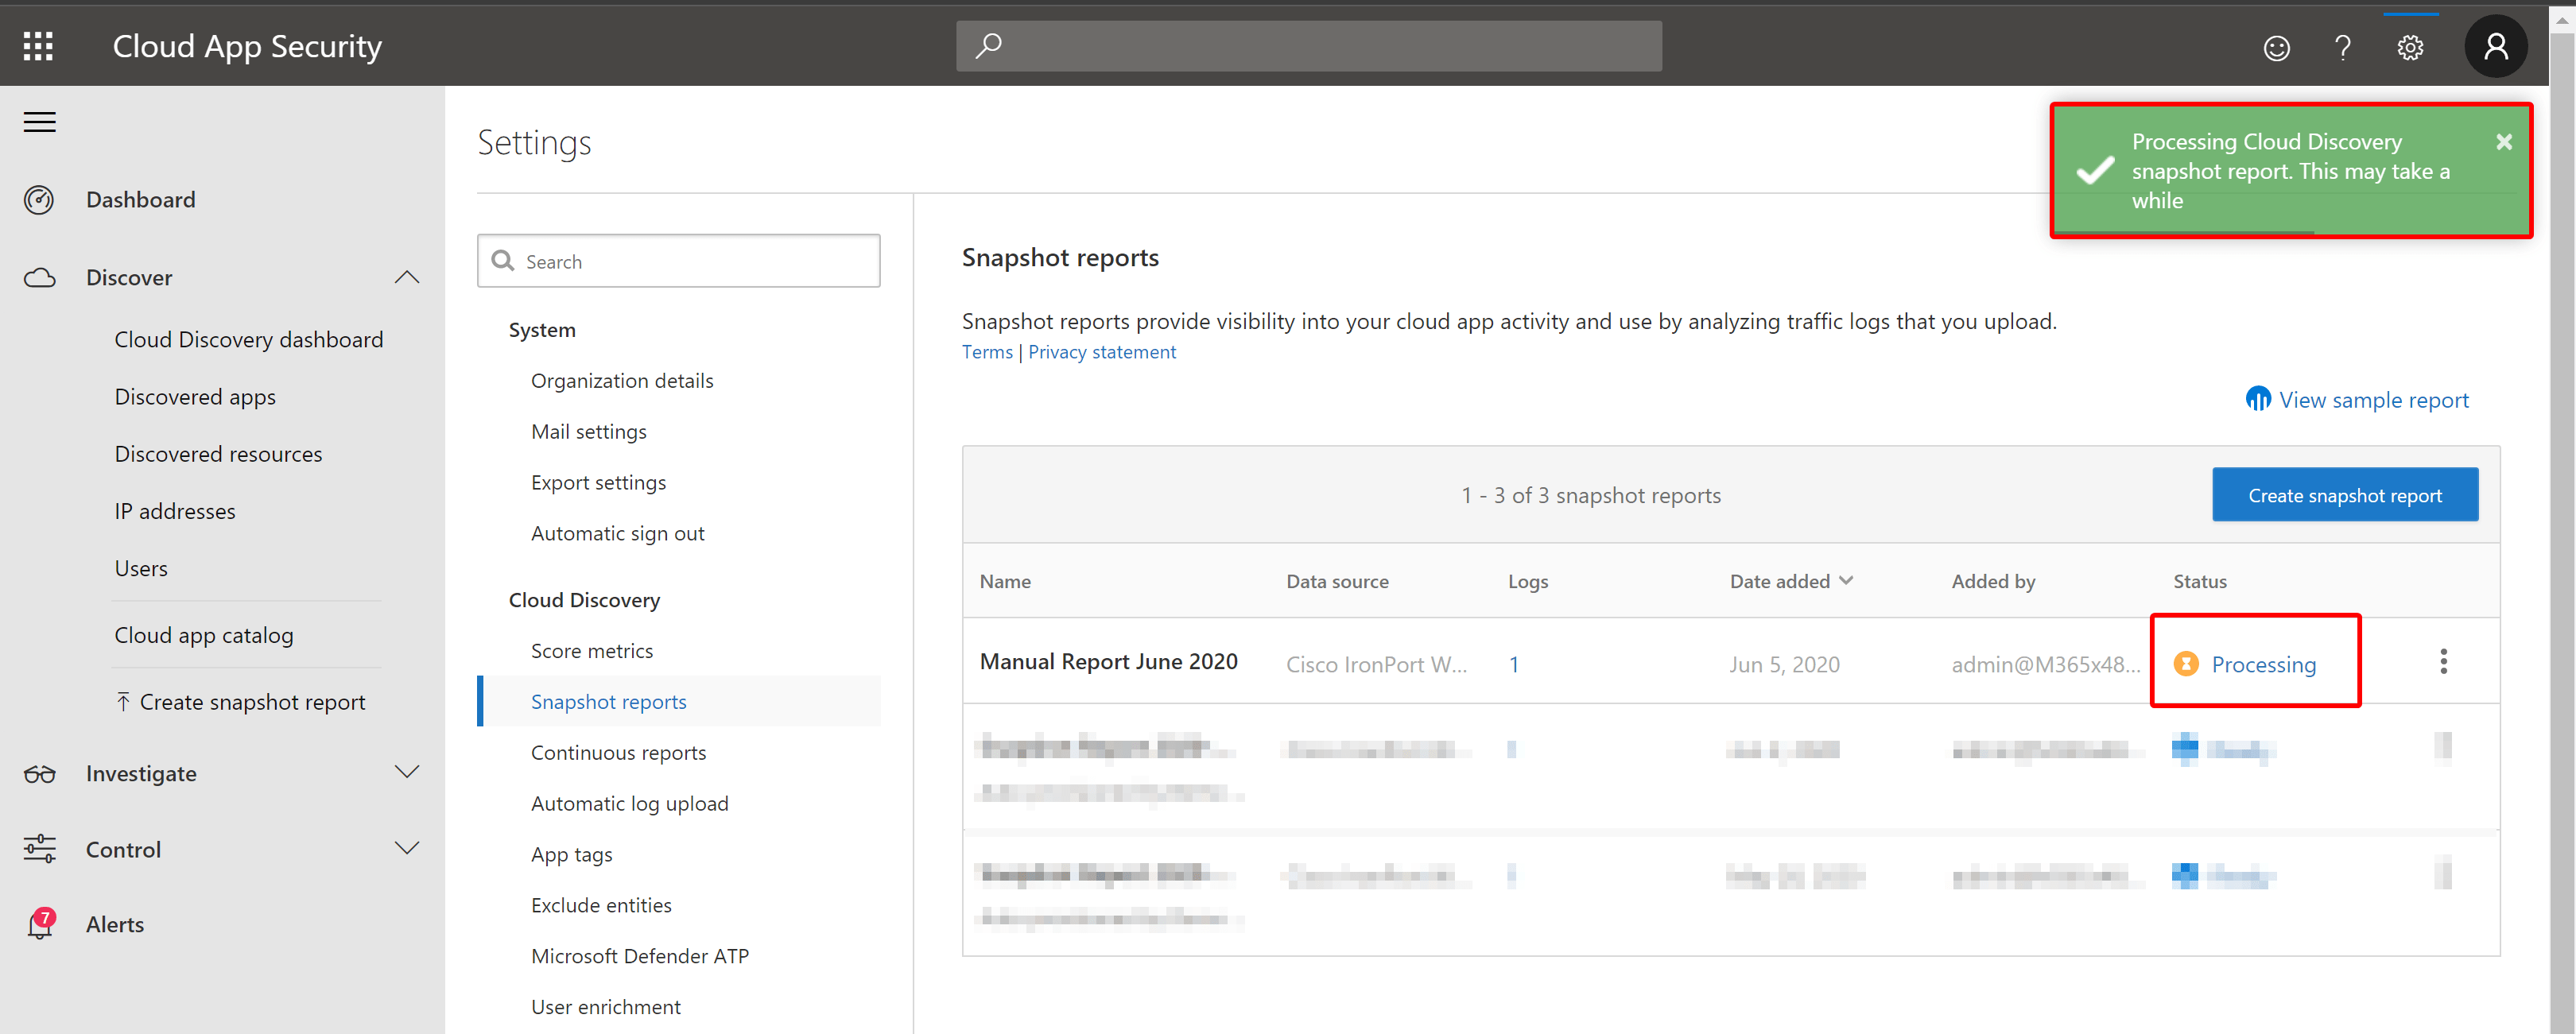
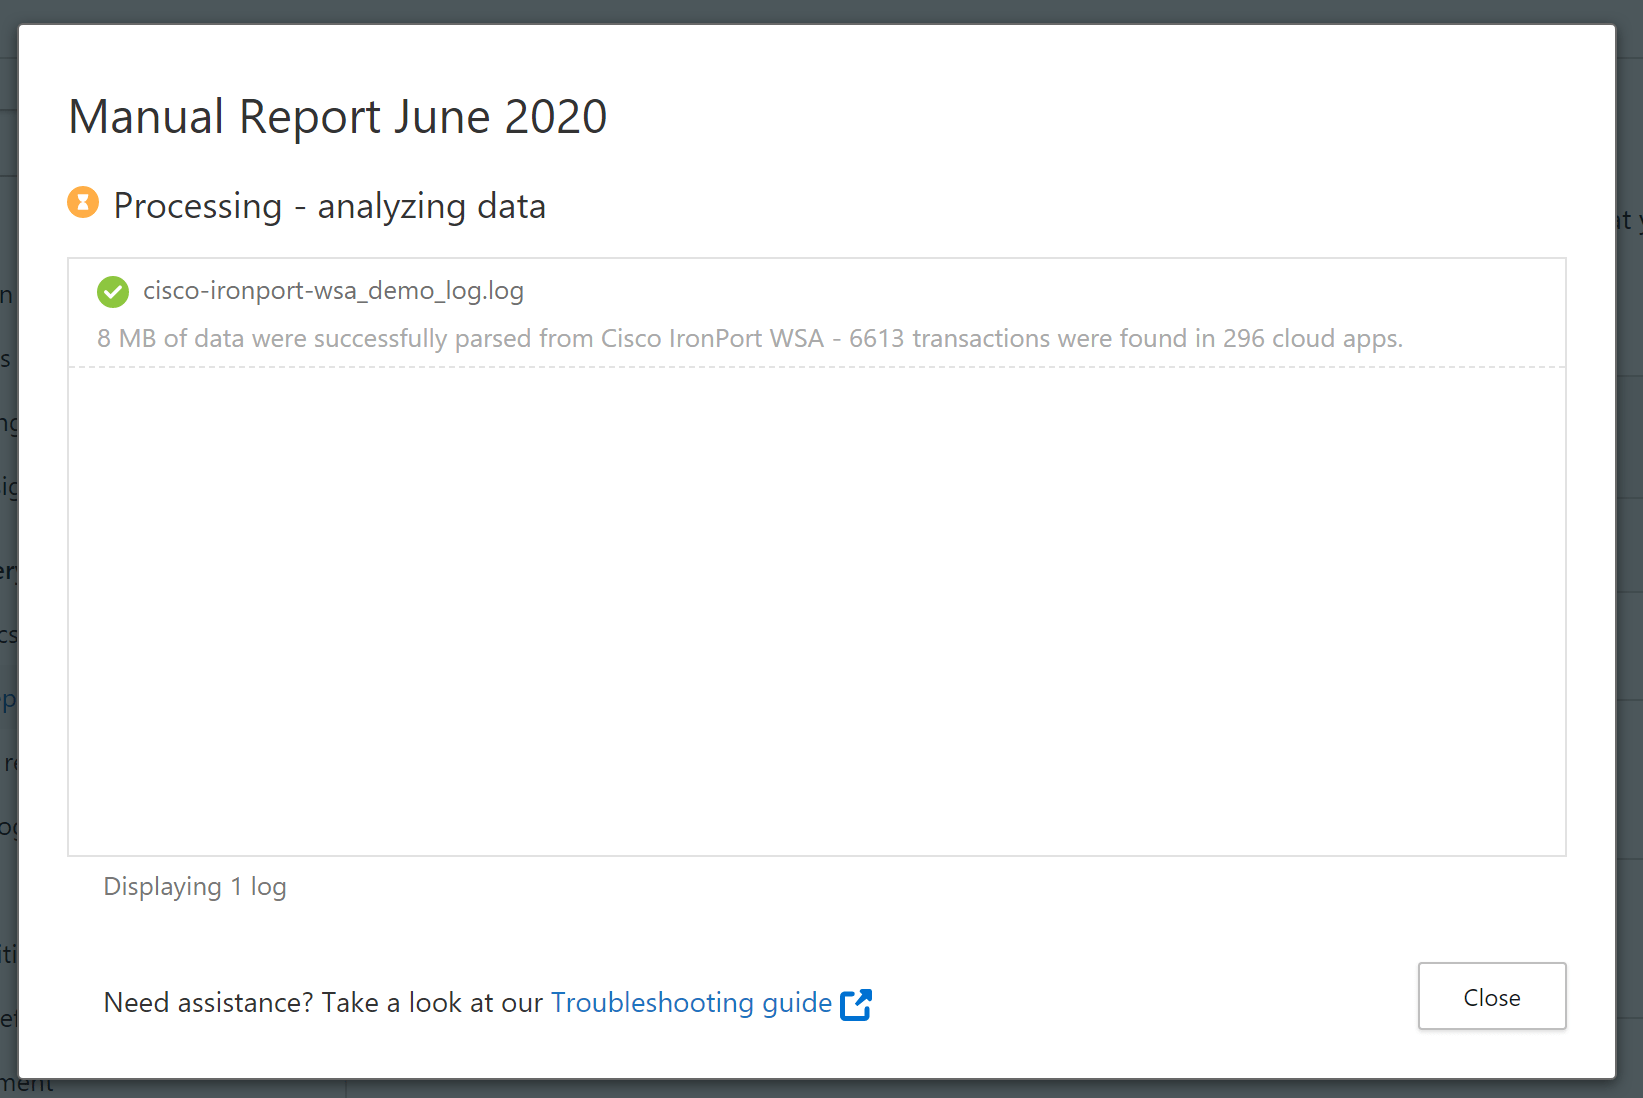
After you have uploaded the file the log is processed. Depending on the size of your log file, this can take a while.
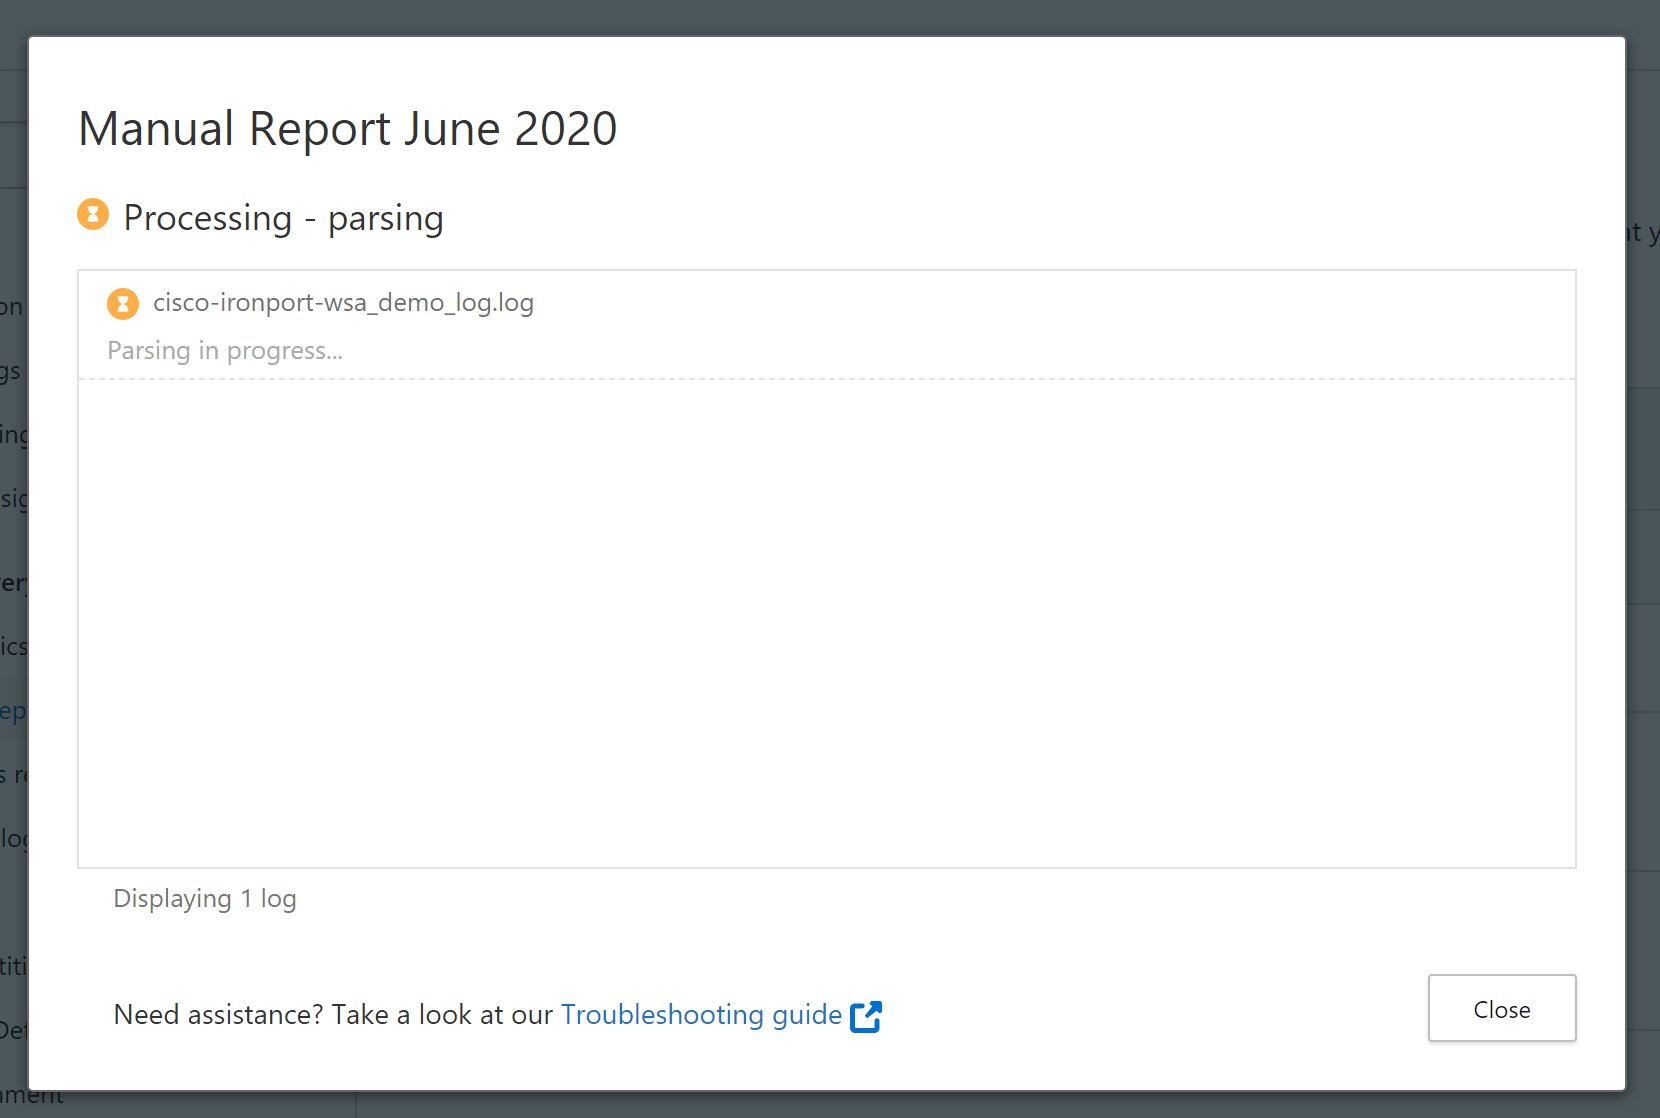
You can track the status while the files are processed.
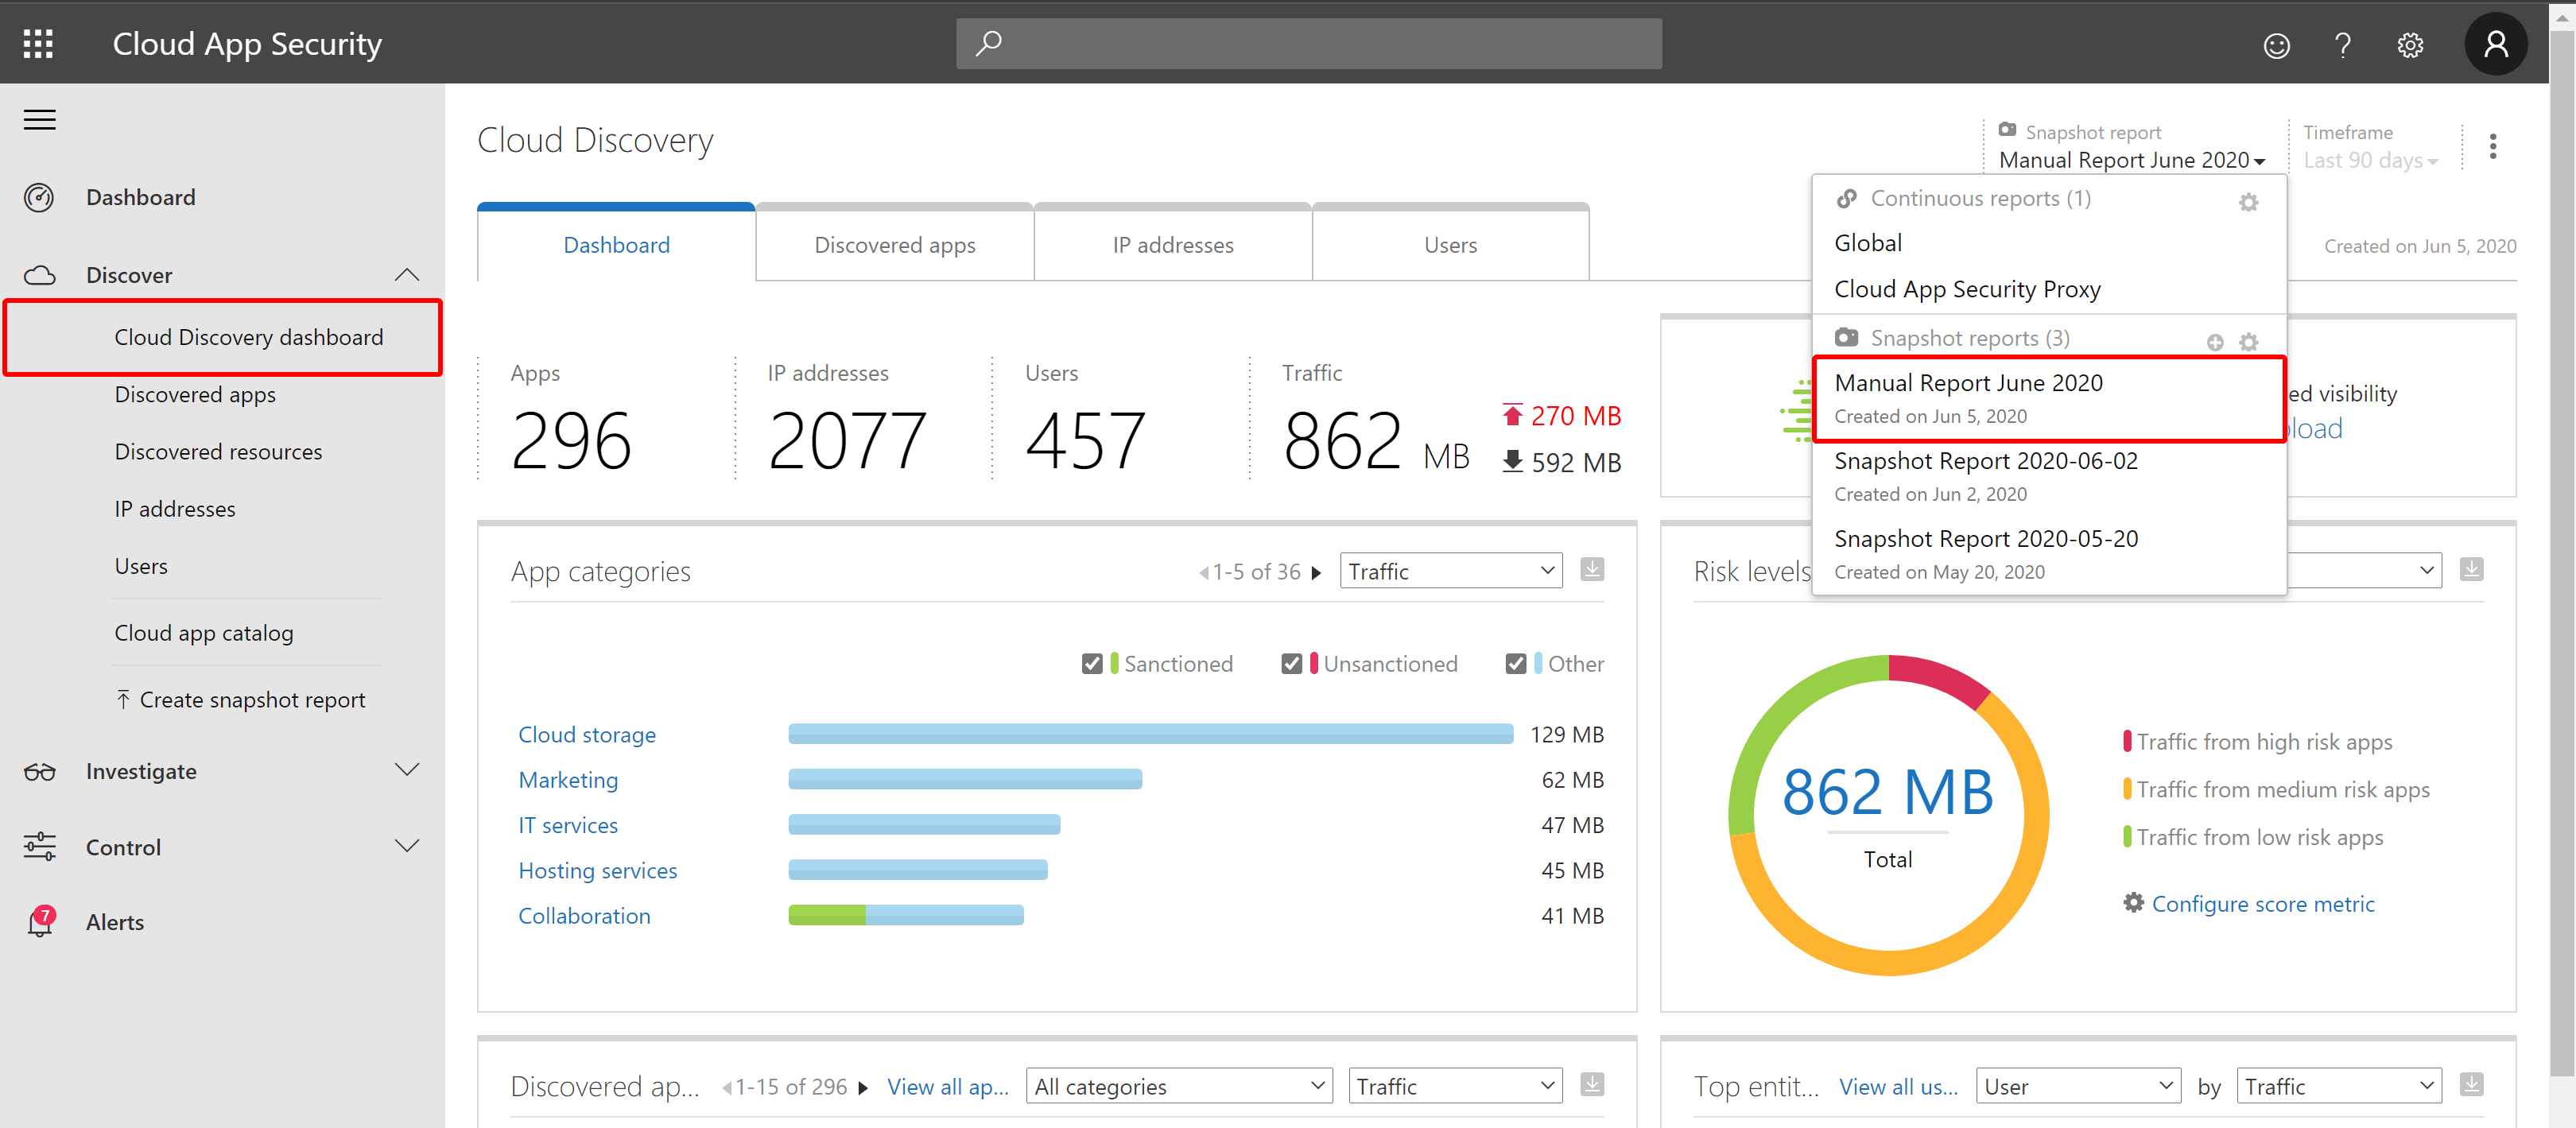
Once the data is parsed and processed, you can go over to the Dashboard and investigate the data. Select the snapshot report we just created.
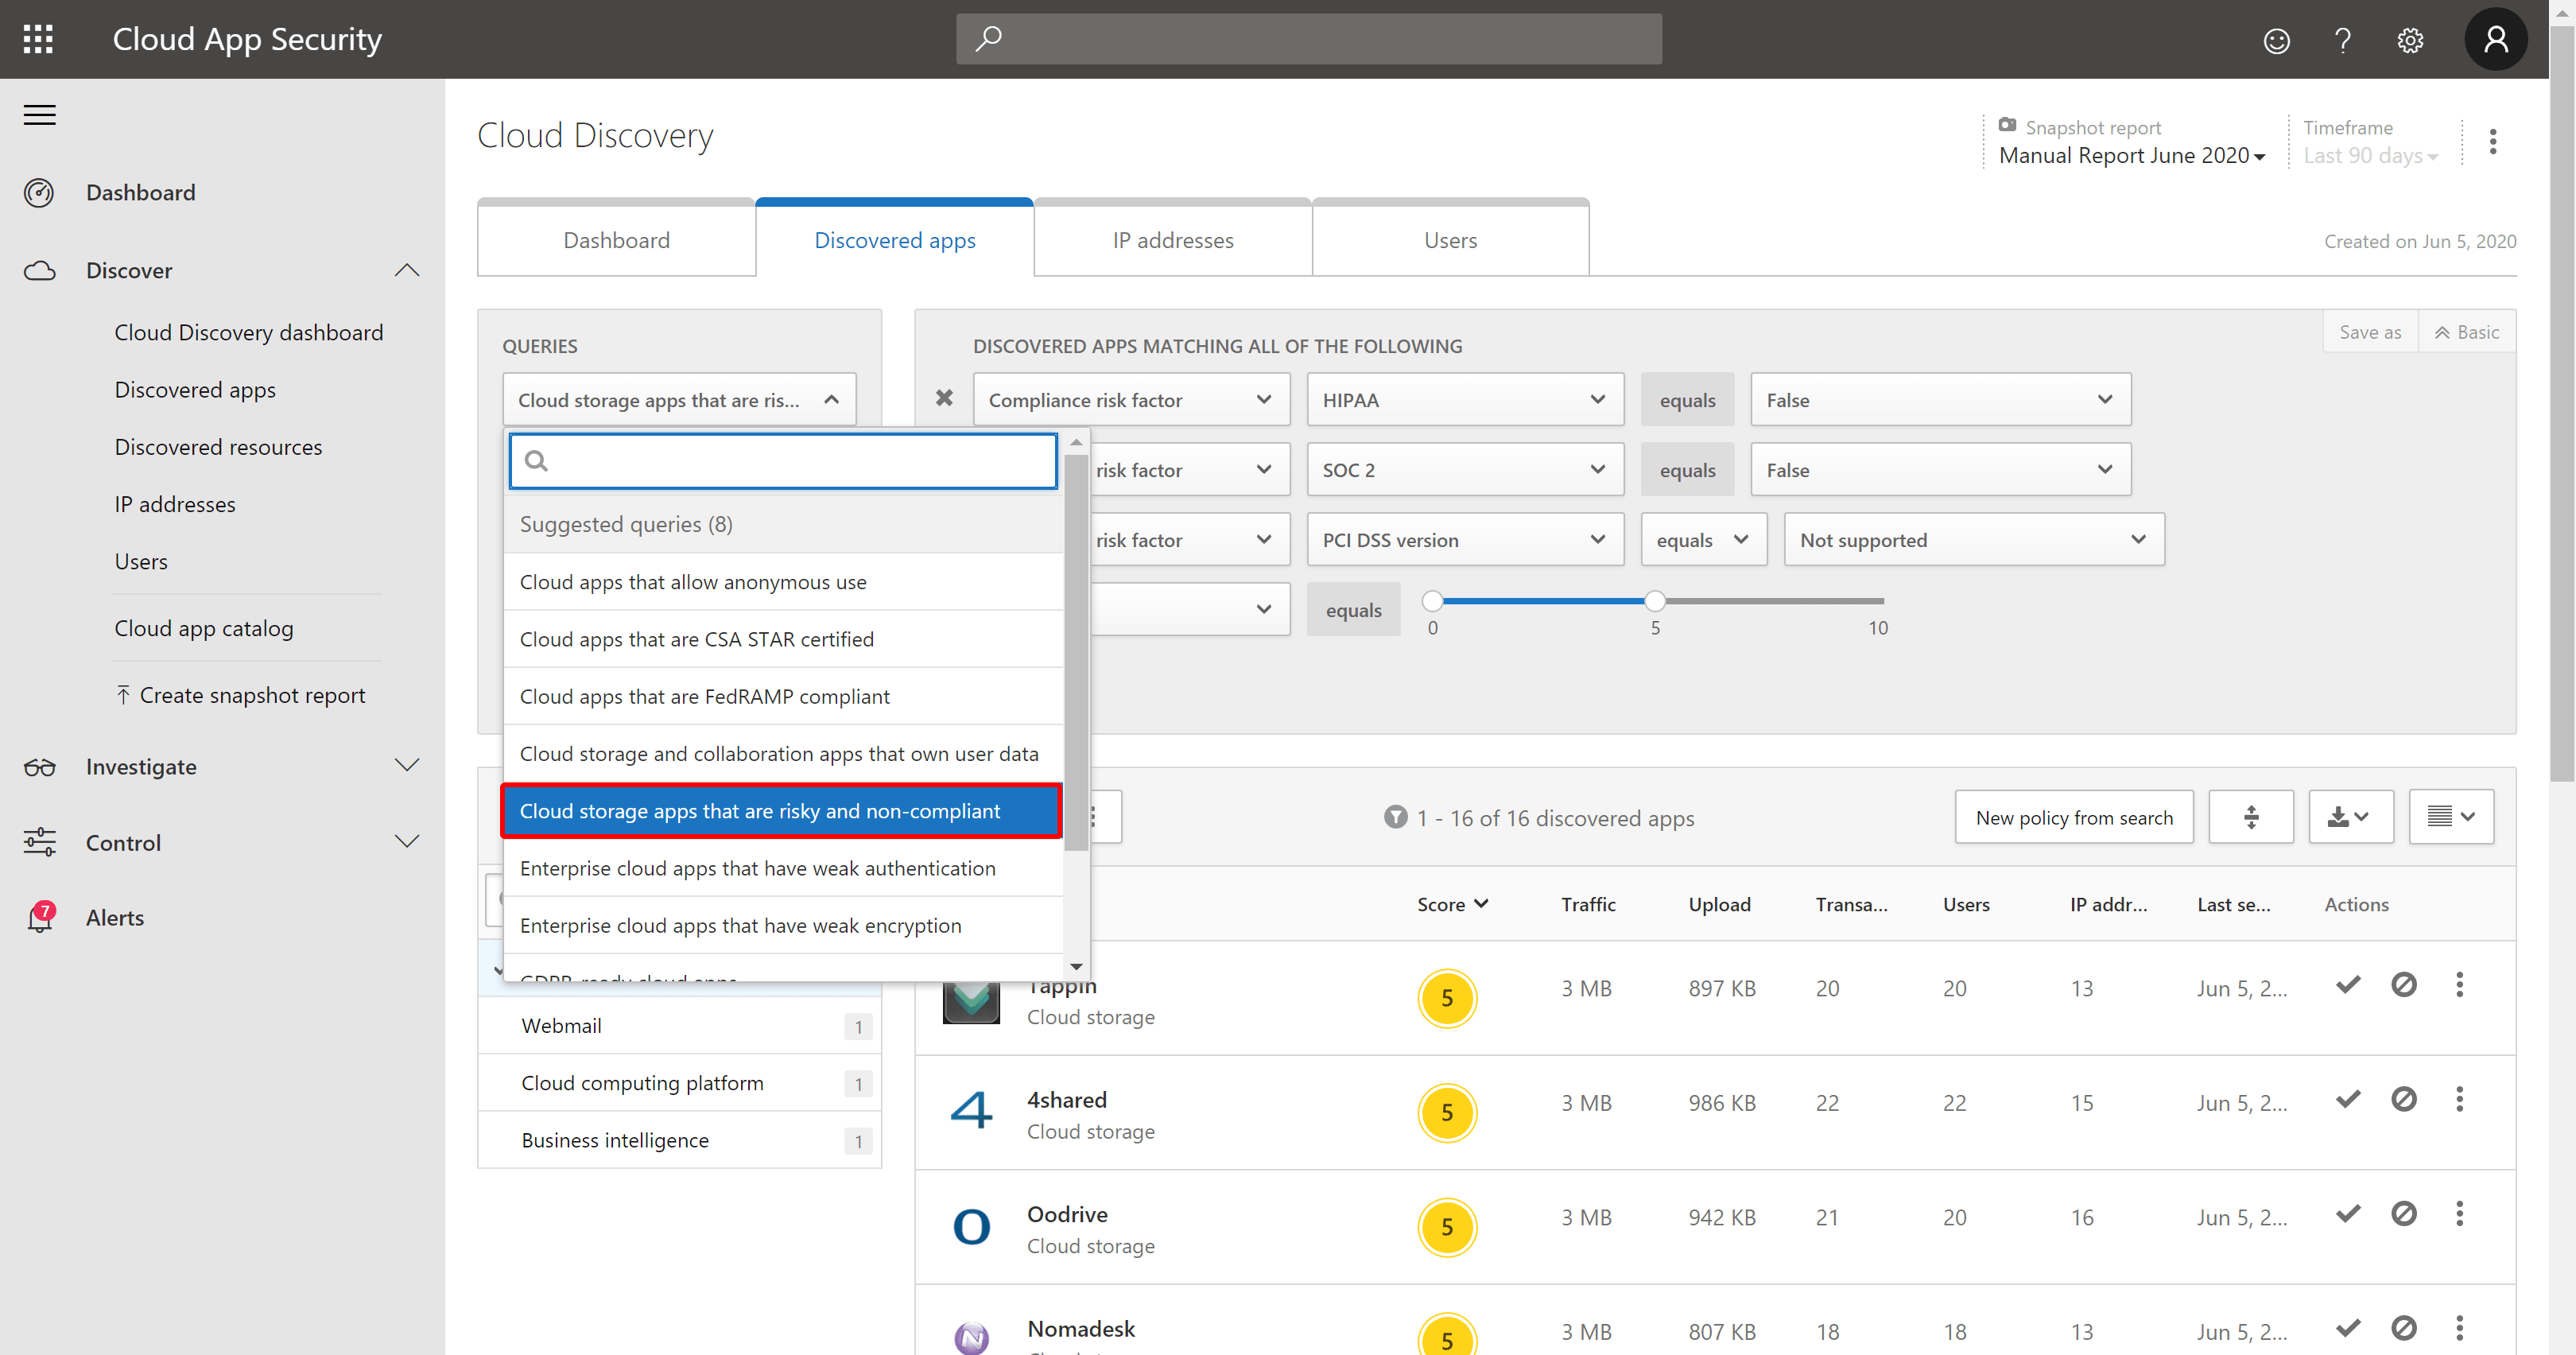
With the data at hand, you can now take a look at the apps that are being used within your organization. You can use the default queries, or create your own.
Automatic log upload for continuous reports#
If your data is parsed correctly, you can now go on and plan for continuous reports. To do that we need to configure a Log Collector. In this blog, I use Docker for Windows to install and configure the Log Collector, but you can also use RedHat or Ubuntu.
Prerequisites#
- OS:
- Windows 10 (fall creators update)
- Windows Server version 1709+ (SAC)
- Windows Server 2019 (LTSC)
- Disk space: 250 GB
- CPU: 2
- RAM: 4 GB
- Set your firewall as described in Network requirements
- Virtualization on the operating system must be enabled with Hyper-V
In this demo, I use a VM on Azure. Make sure your VM supports Hyper-V, otherwise Docker will fail to run.
Add data source#
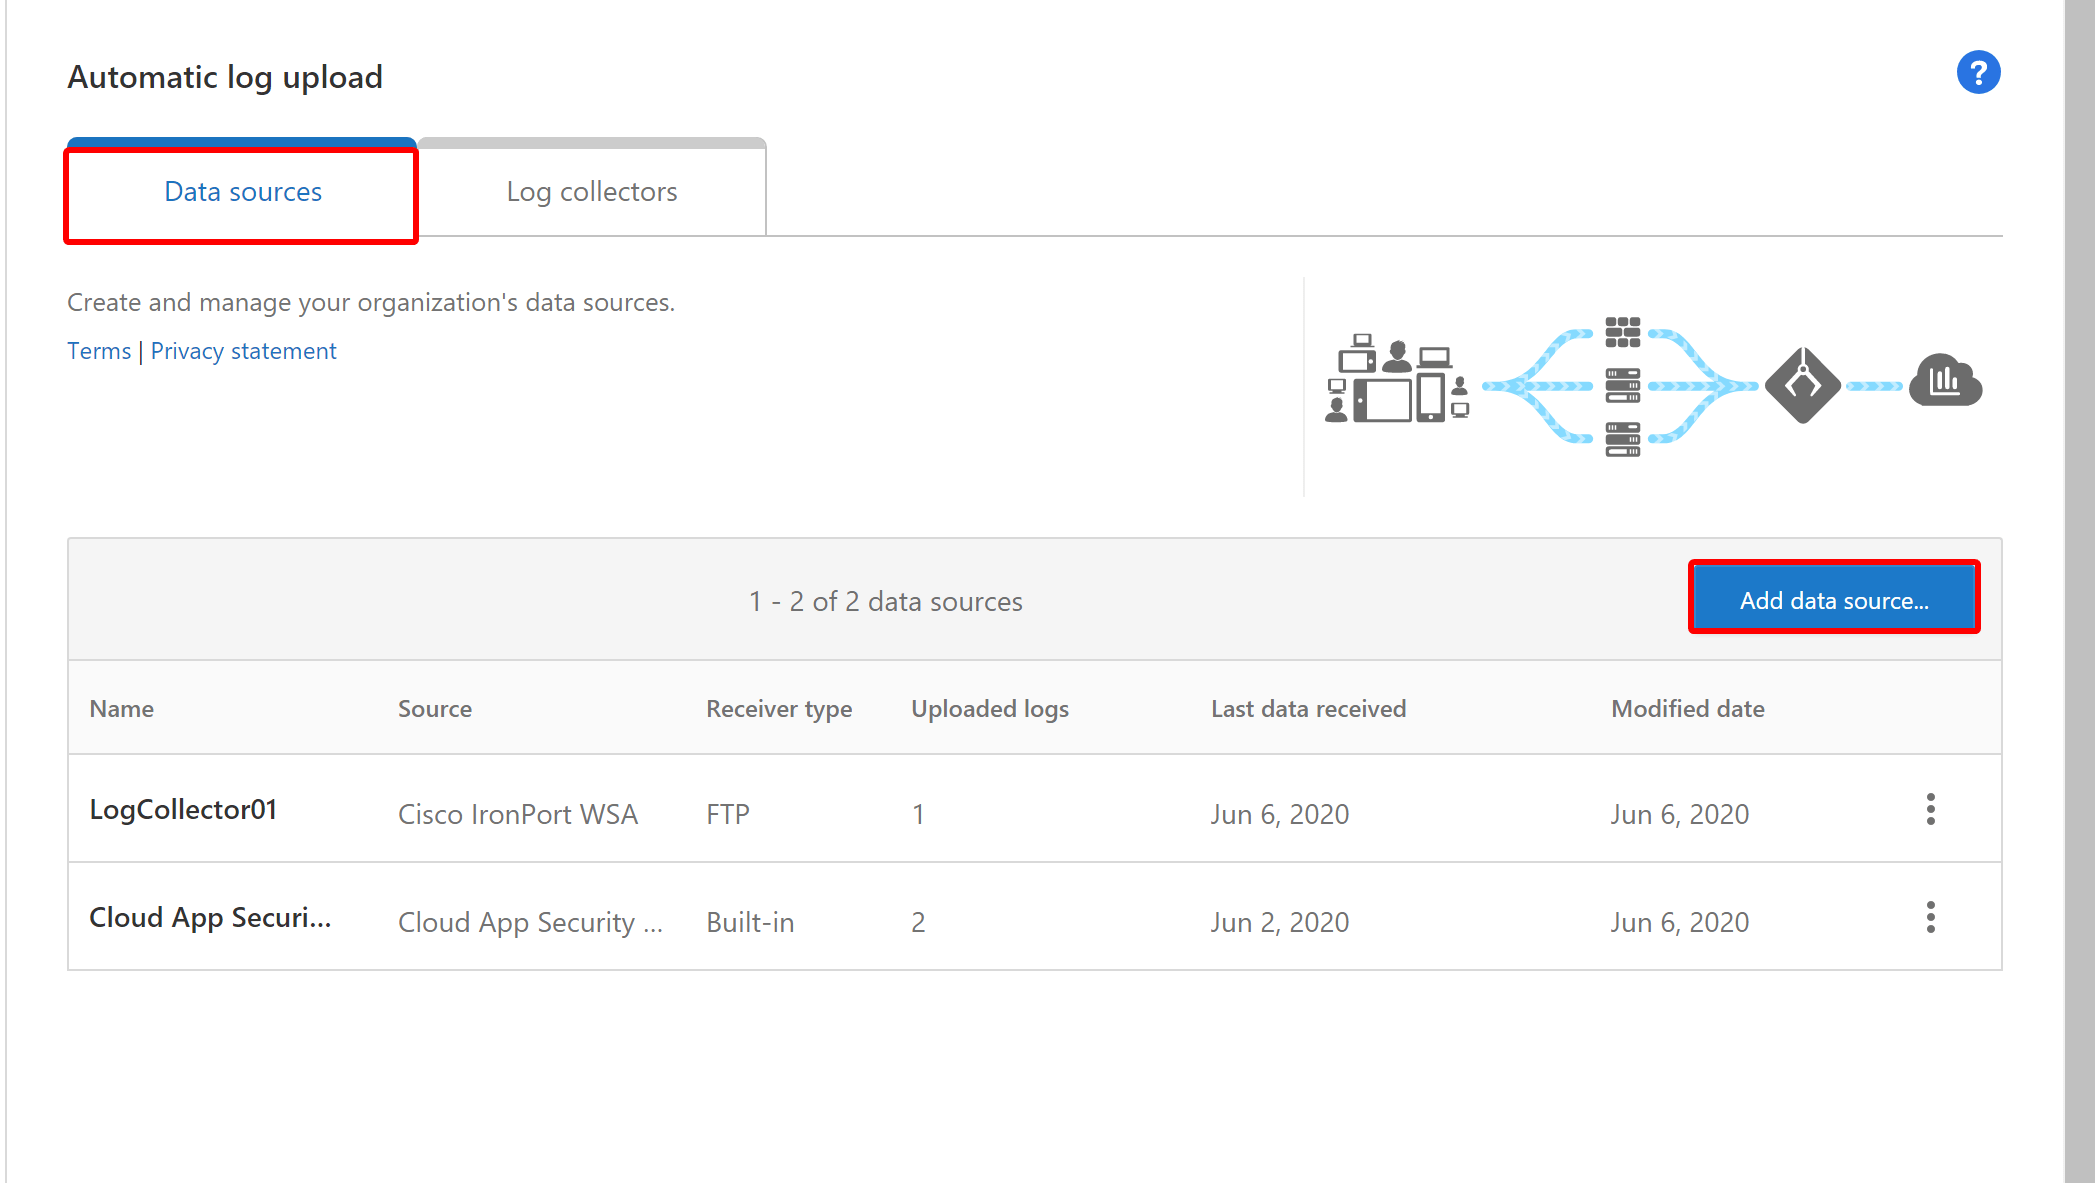
In the MCAS portal, go to the Log Collectors overview.
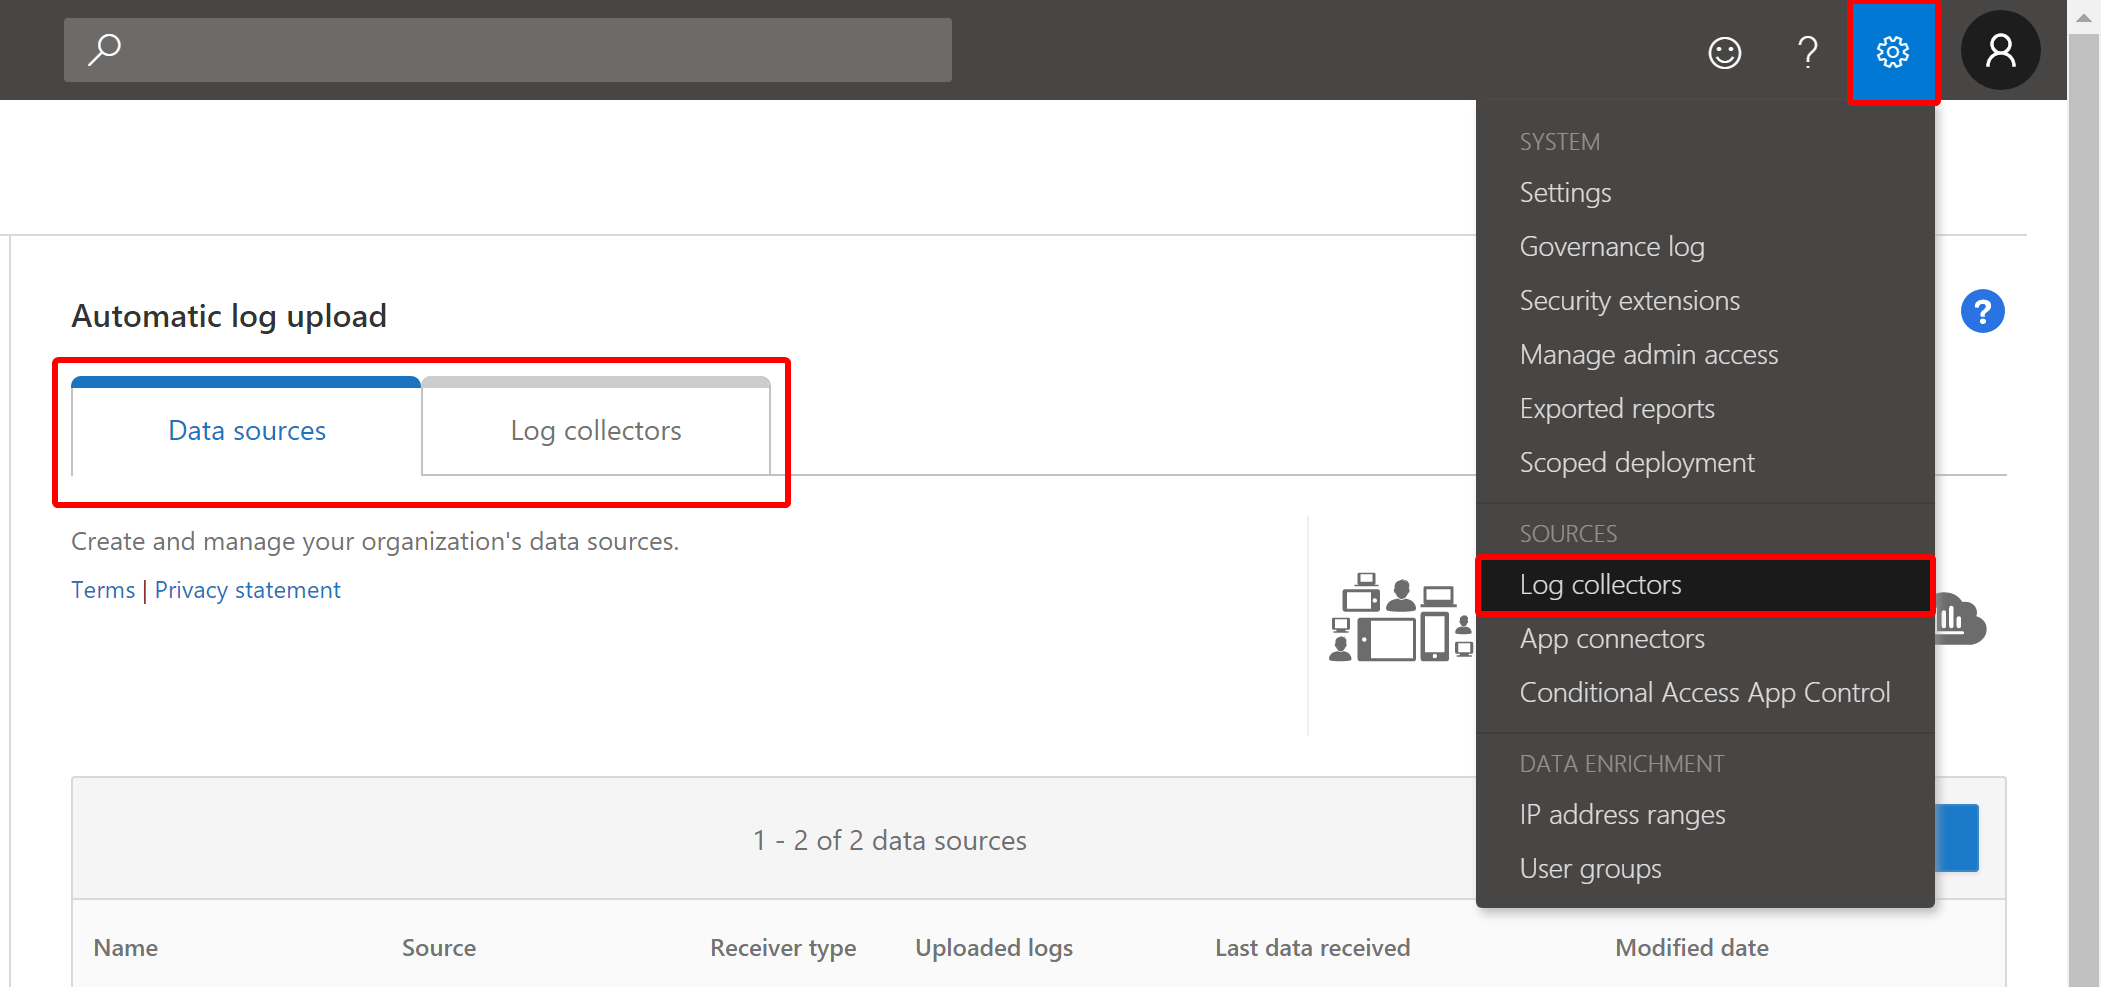
Create a new data source and select the correct source and receiver type. I use FTP.
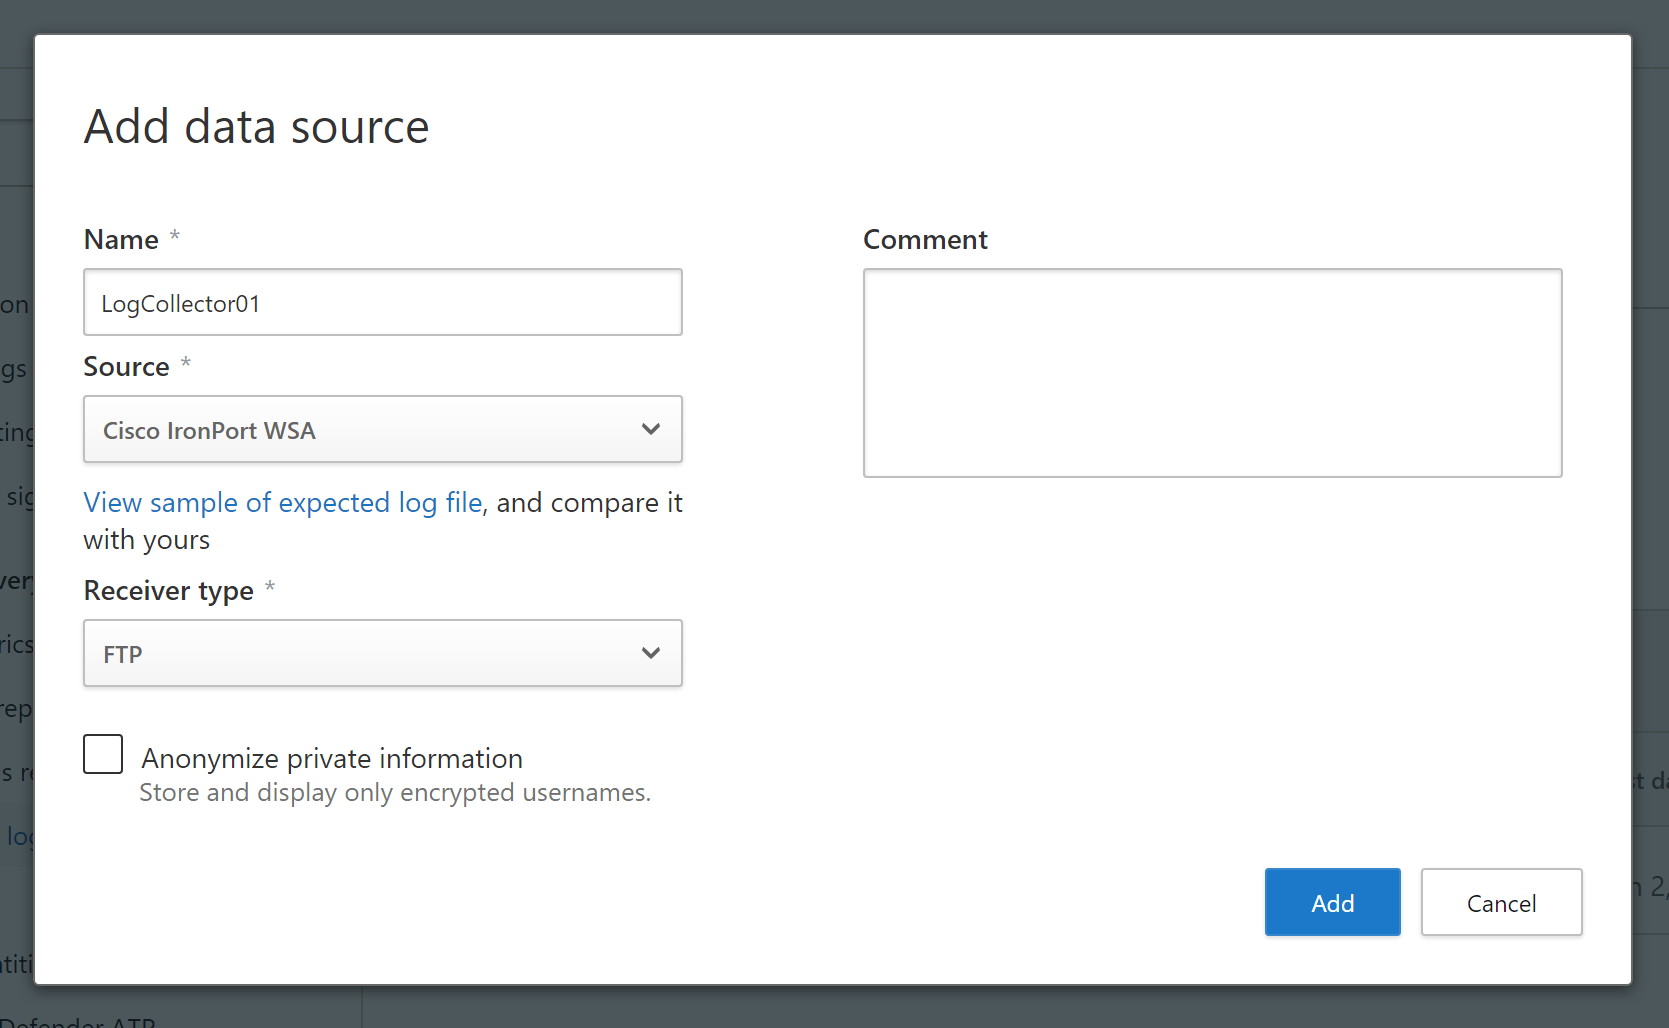
Next, create the Log Collector. Use the IP address (or DNS name) of the machine you have prepped to use with Docker. As data source, select the one that we created in the previous step.
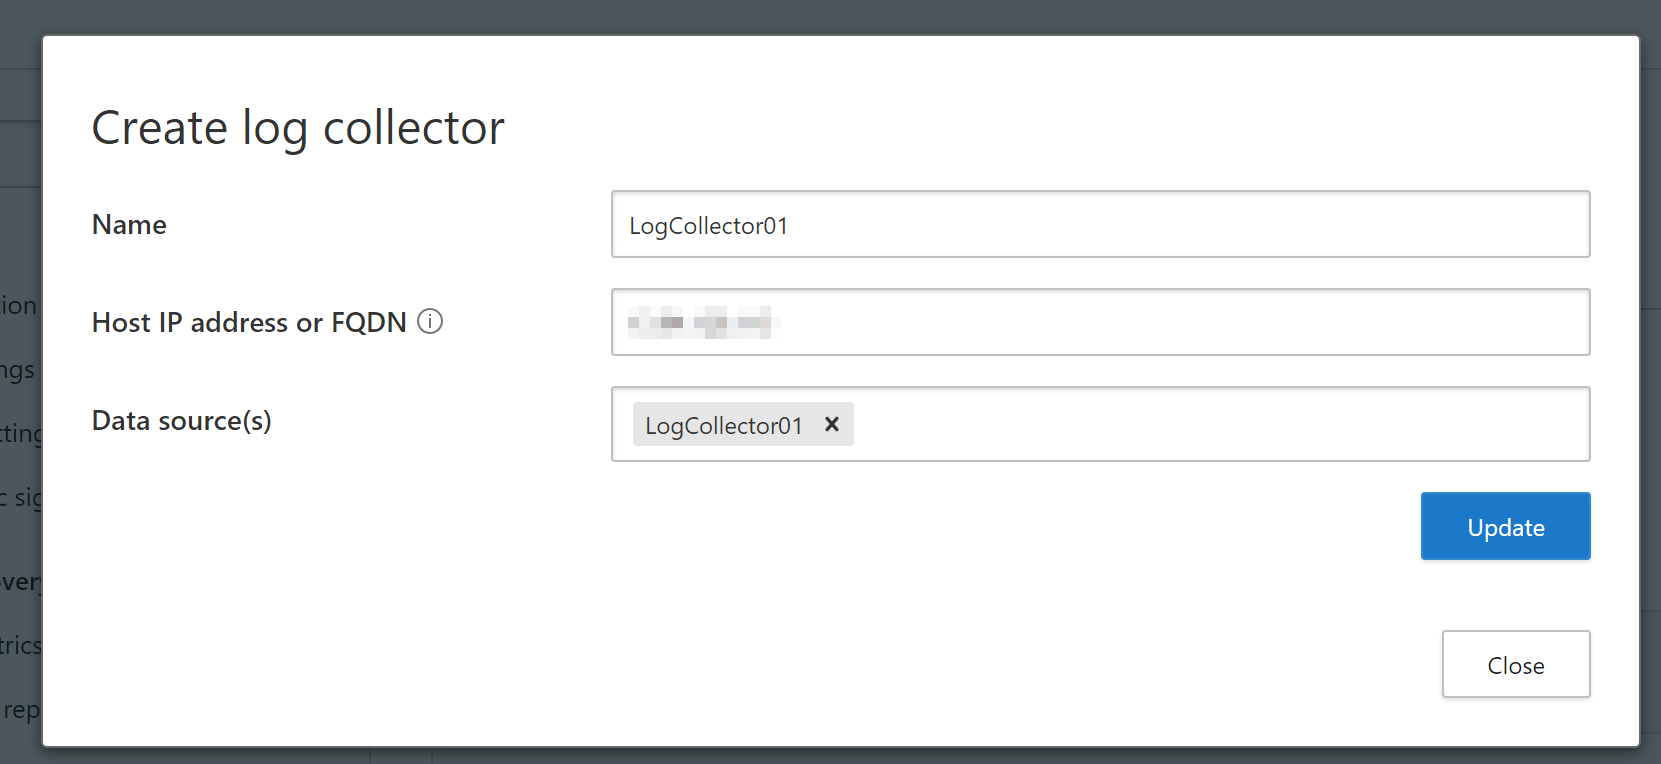
Copy the configuration command and the FTP username and password for later use!
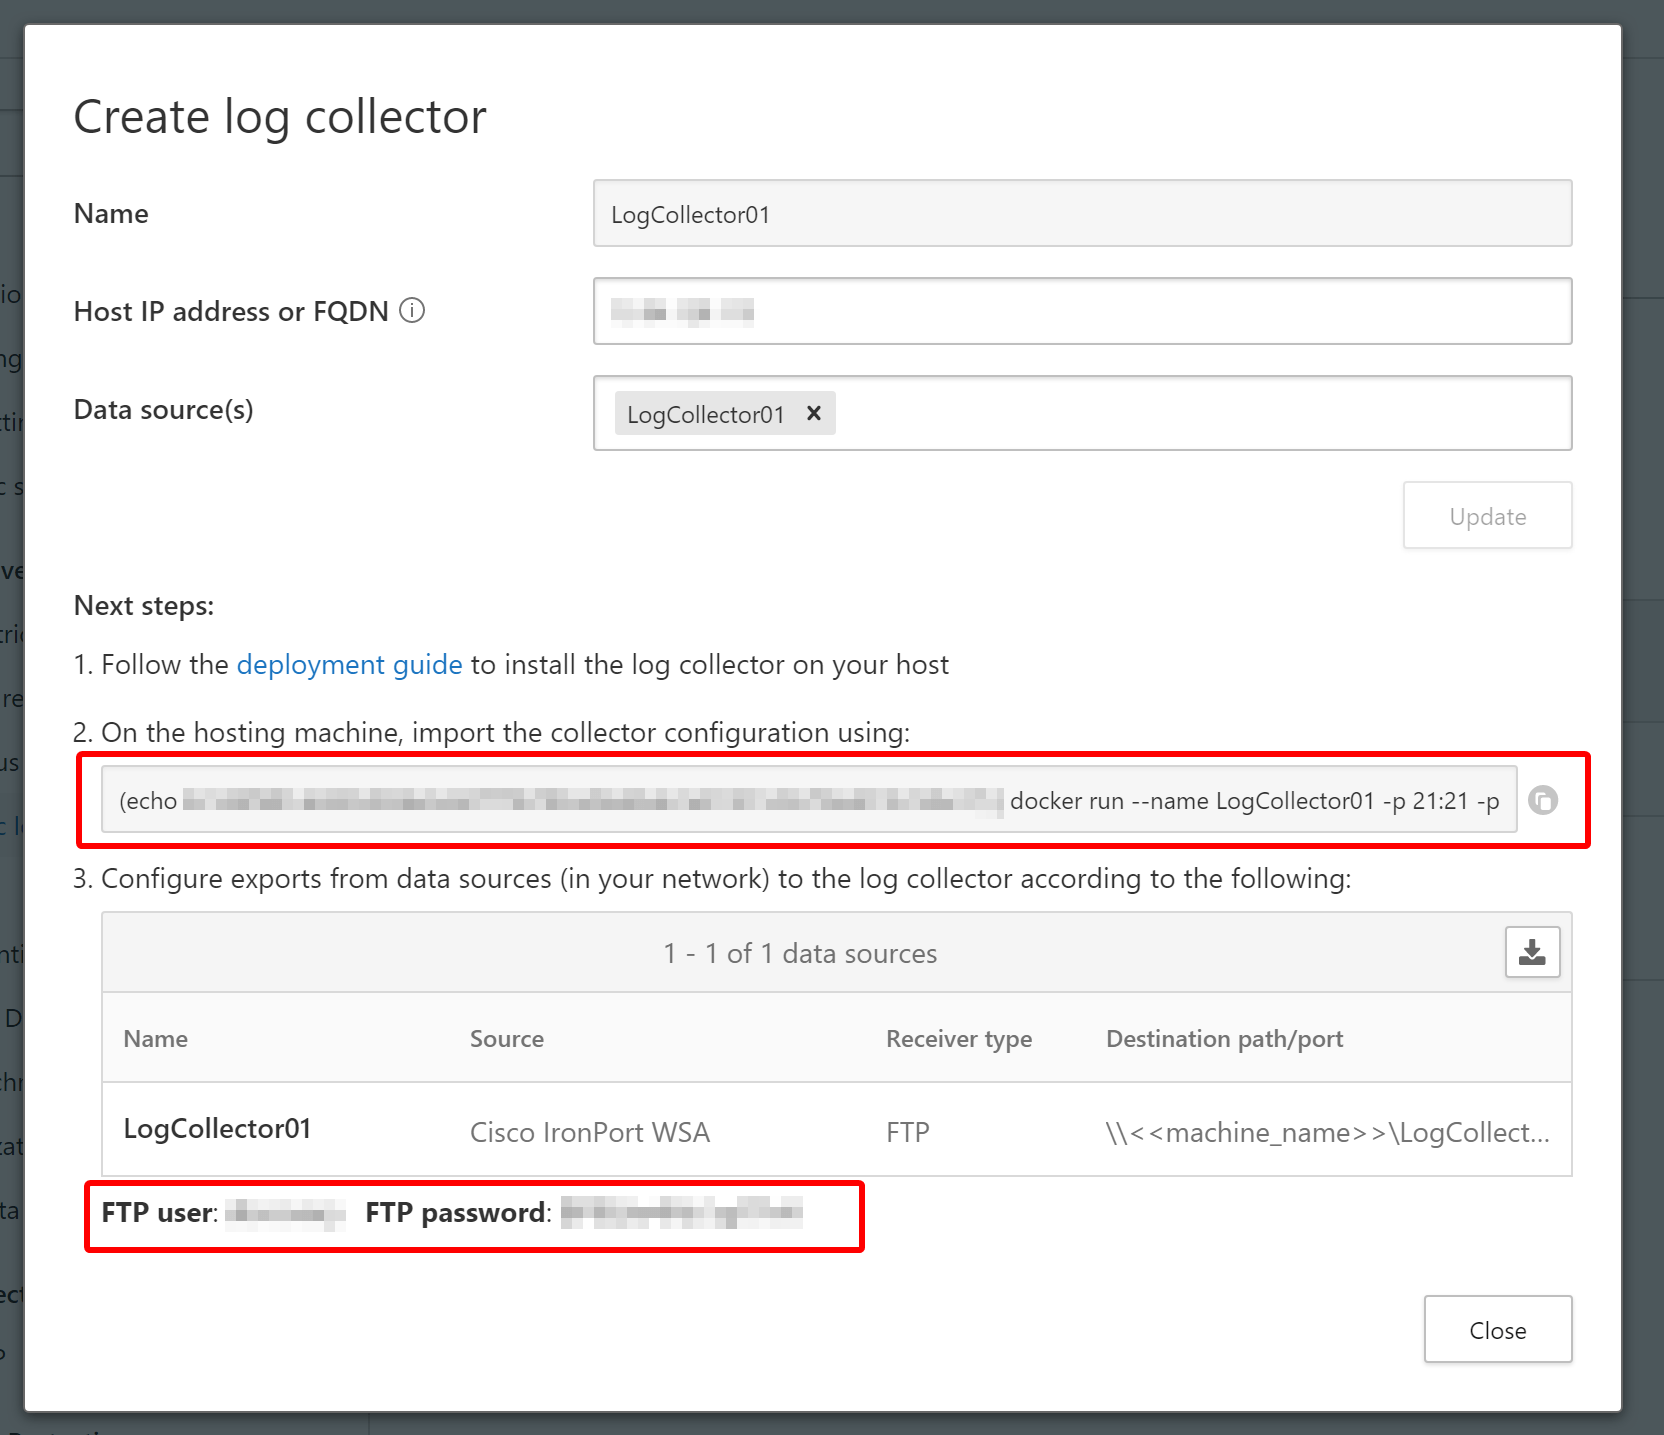
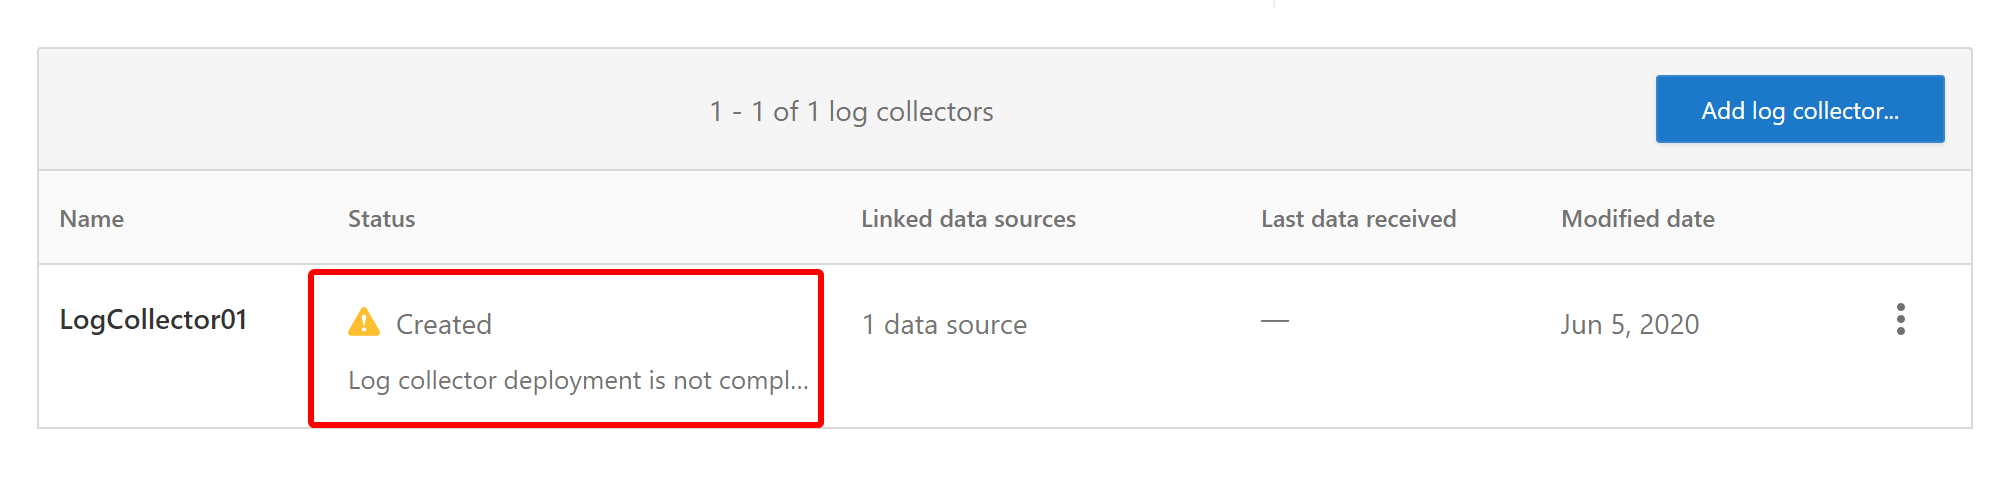
You can check that the Collector is created, but is not configured yet. This will be done in the next step.
Install and configure Docker on Windows#
Now both data source and app collector are in place, we can go on and configure the Windows machine with Docker.
Head over to your machine and run PowerShell as an administrator. Run the following command to download the install script to your temp folder:
Invoke-WebRequest https://adaprodconsole.blob.core.windows.net/public-files/LogCollectorInstaller.ps1 -OutFile (Join-Path $Env:Temp LogCollectorInstaller.ps1)The script is downloaded in the temp folder.
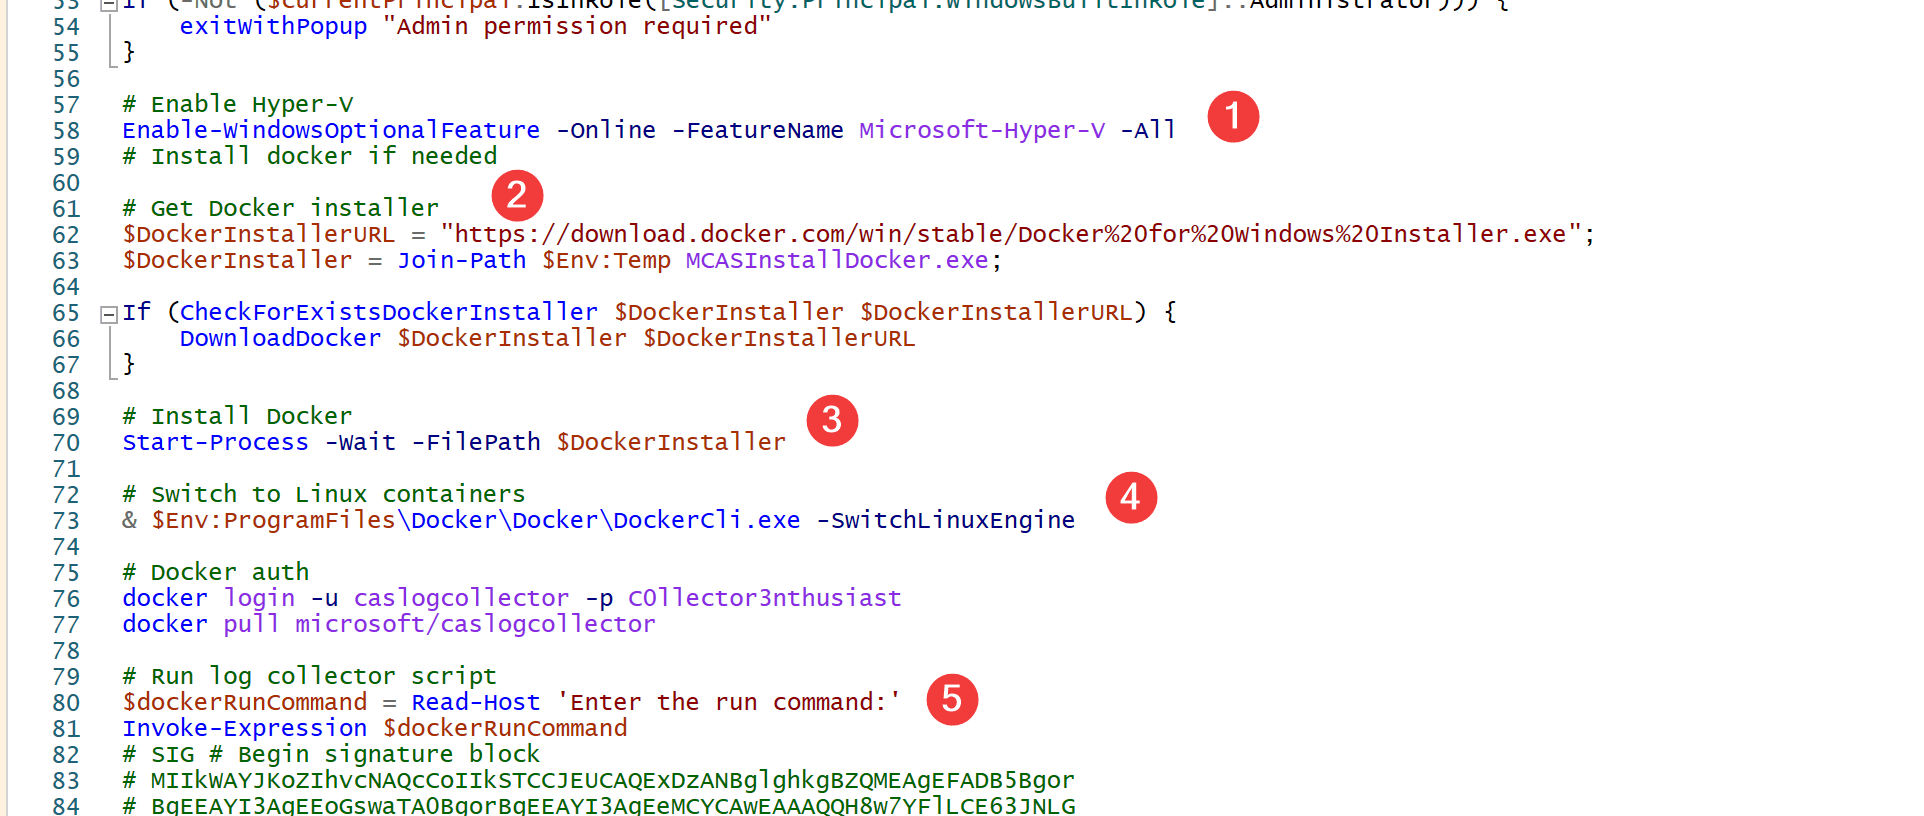
If you take a look at the script, it will to a couple of things:
- Install Hyper-V
- Download the Docker setup file
- Install Docker
- Switch the configuration to Linux containers
- Asks for the run command that you’ve captured earlier.
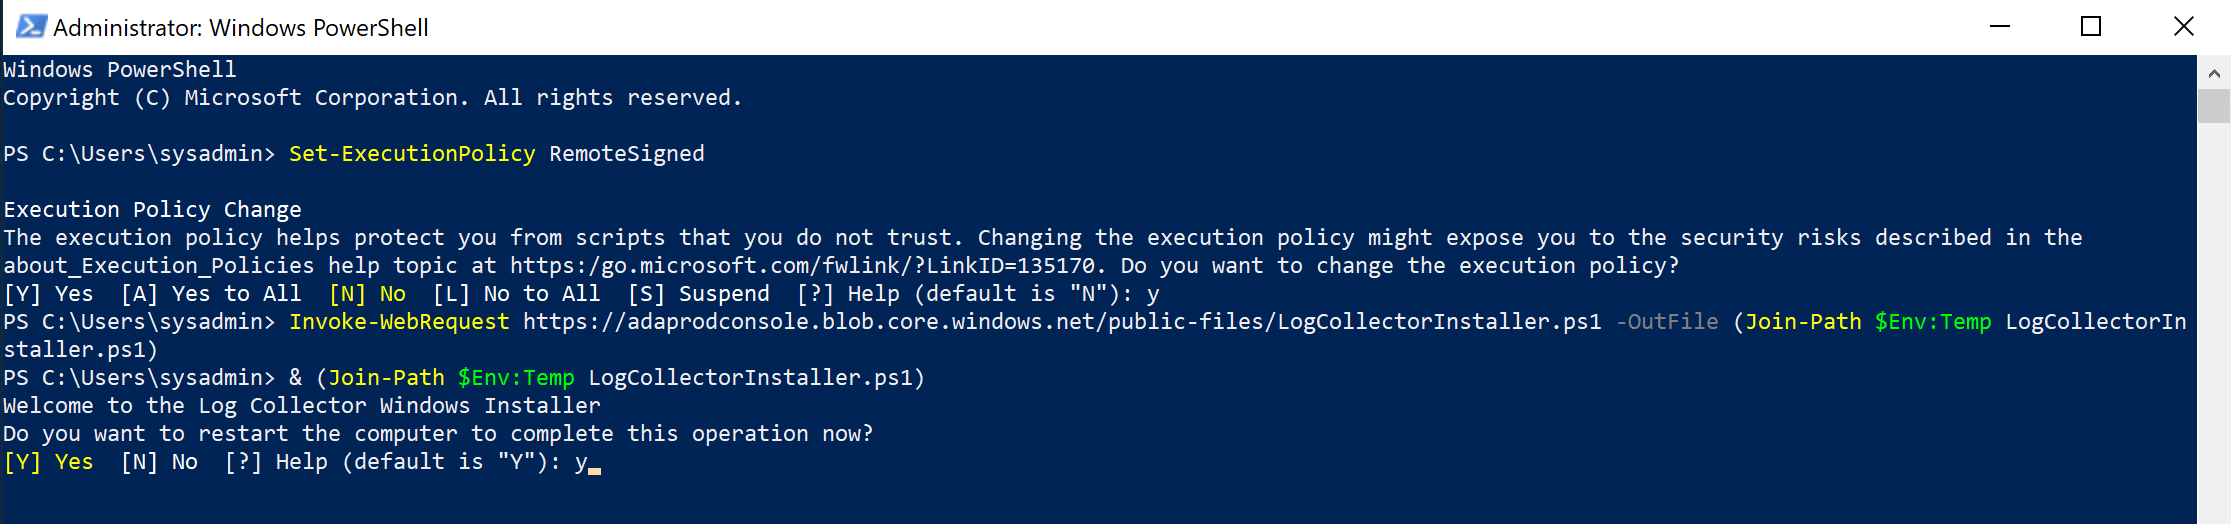
Before running the script, set the execution policy to remote signed.
Set-ExecutionPolicy RemoteSignedKick off the script by running & (Join-Path $Env:Temp LogCollectorInstaller.ps1)
The machine may reboot a couple of times. Each time the machine is rebooted, re-run the script: & (Join-Path $Env:Temp LogCollectorInstaller.ps1)
Before the install script ends, it will ask for the configuration command that you copied earlier. Basically, this command will install the Docker container. If the installer is finished, you see the LogCollector instance created in Docker.
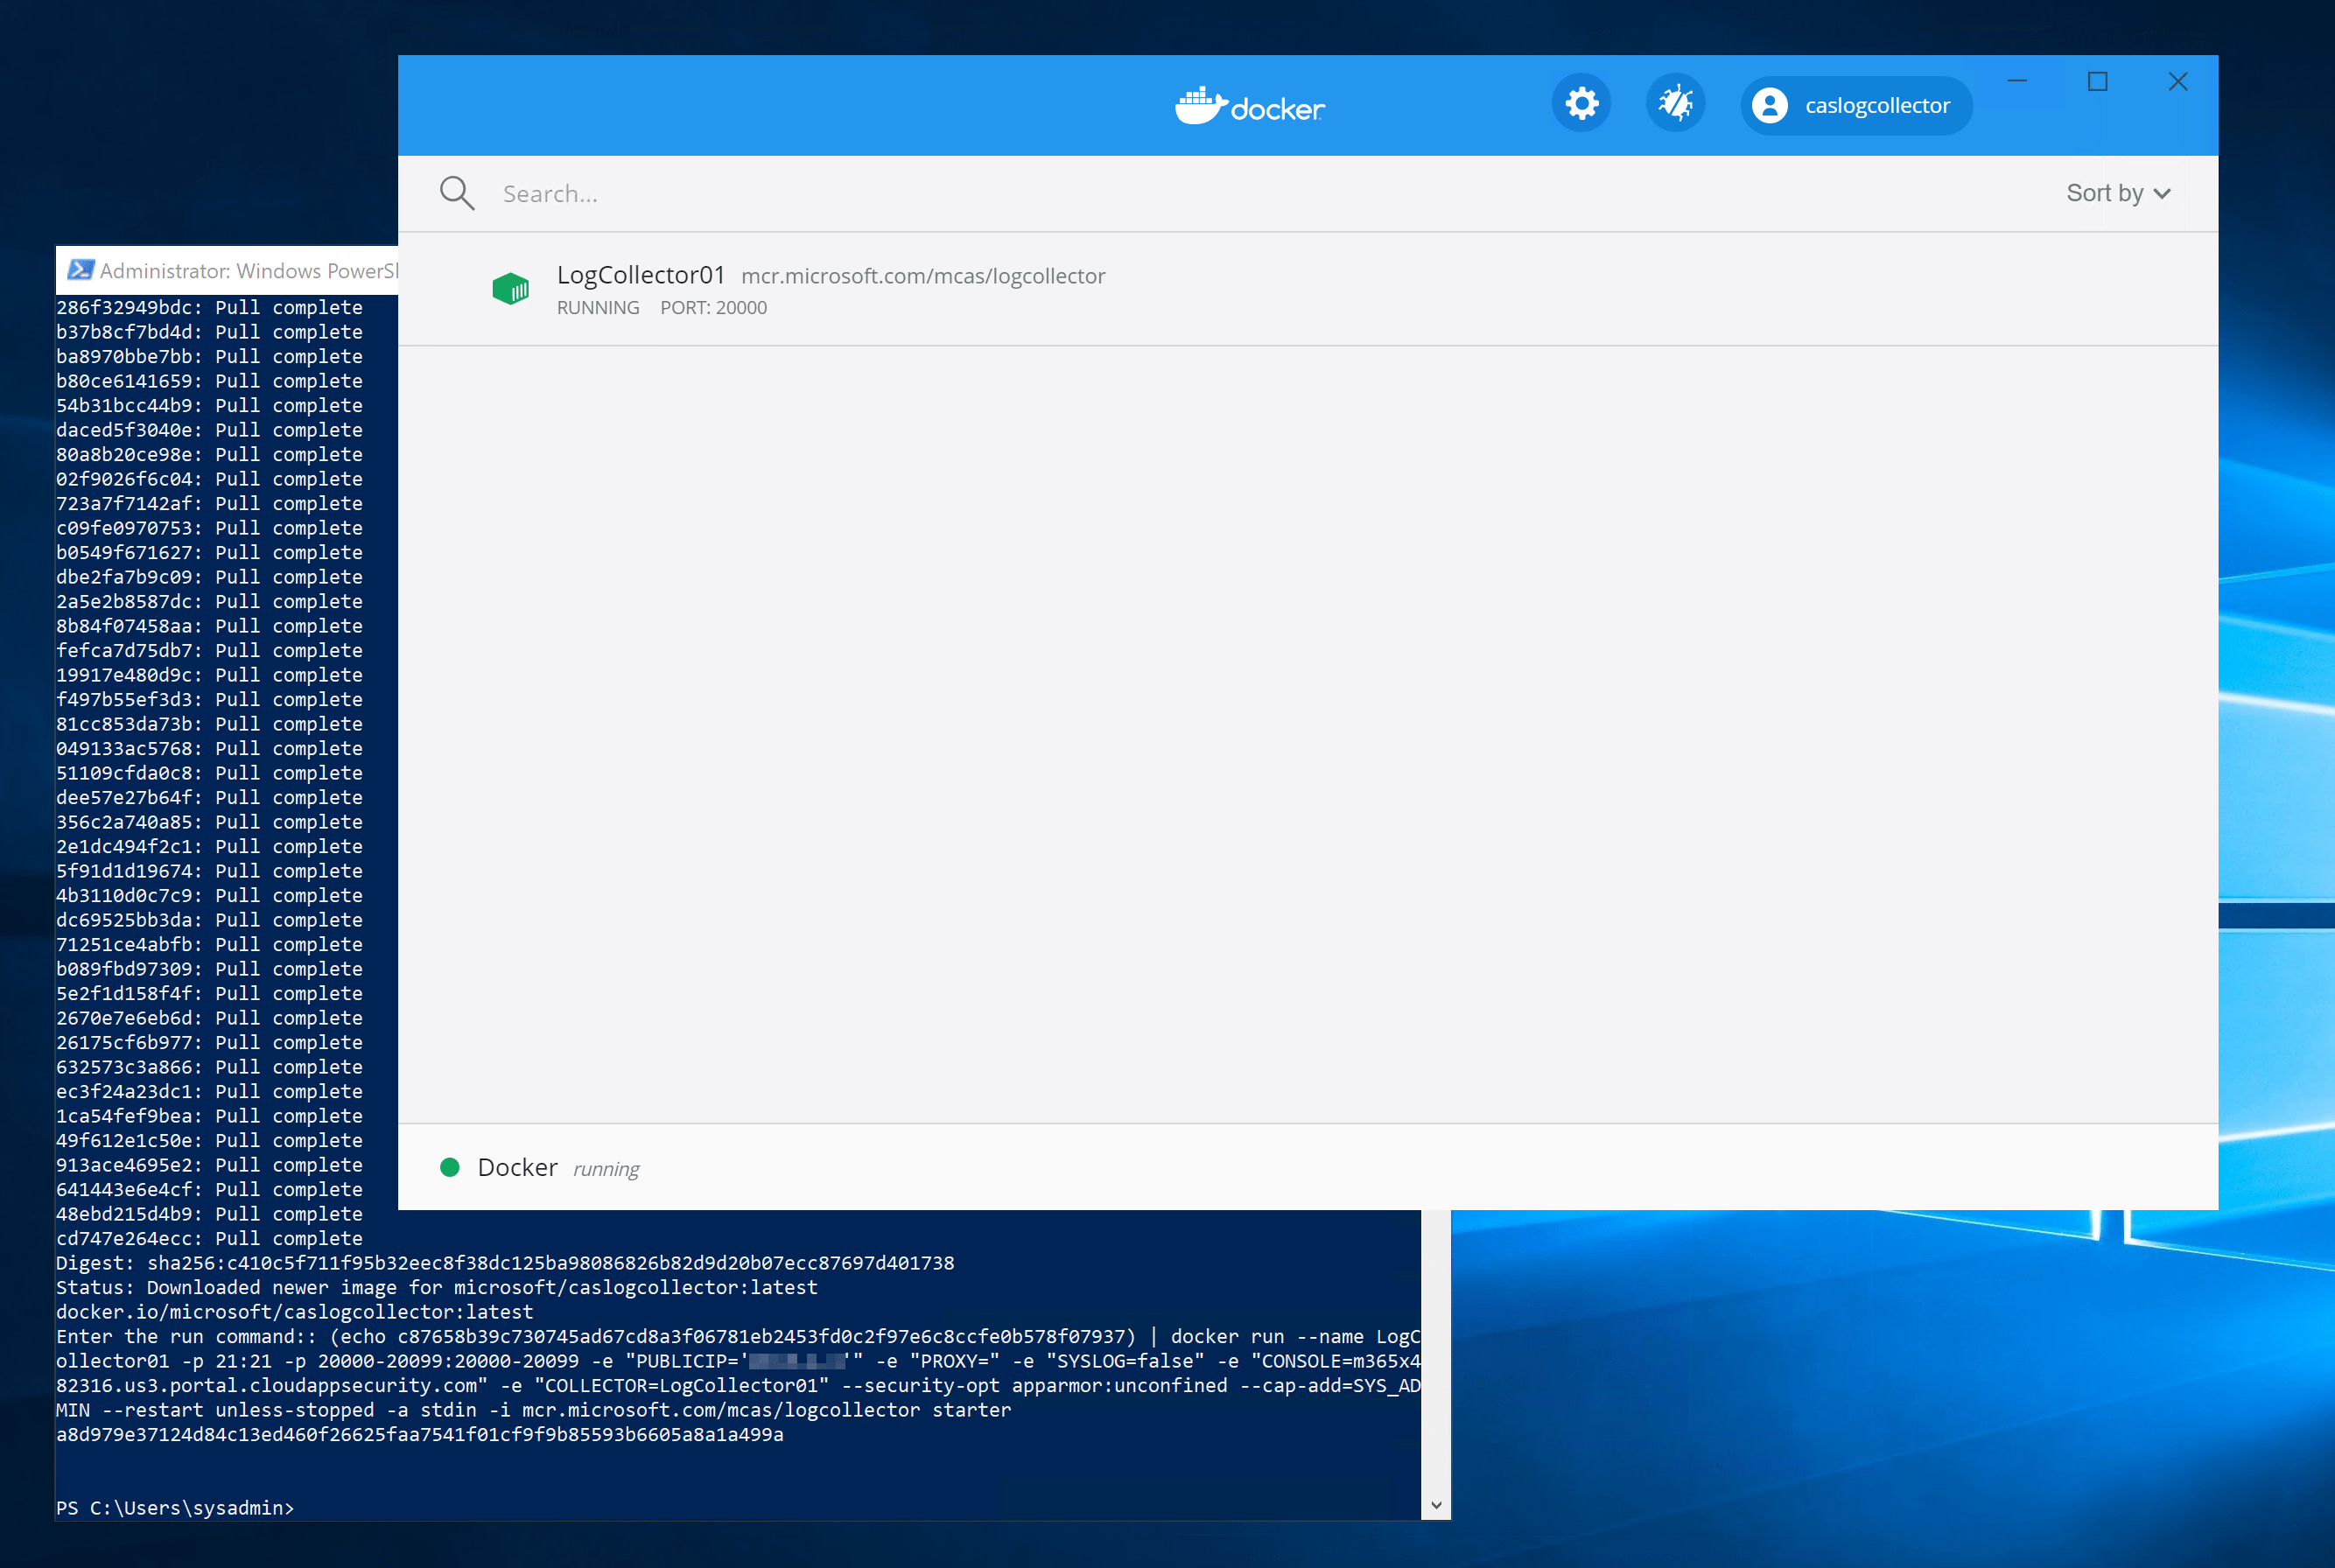
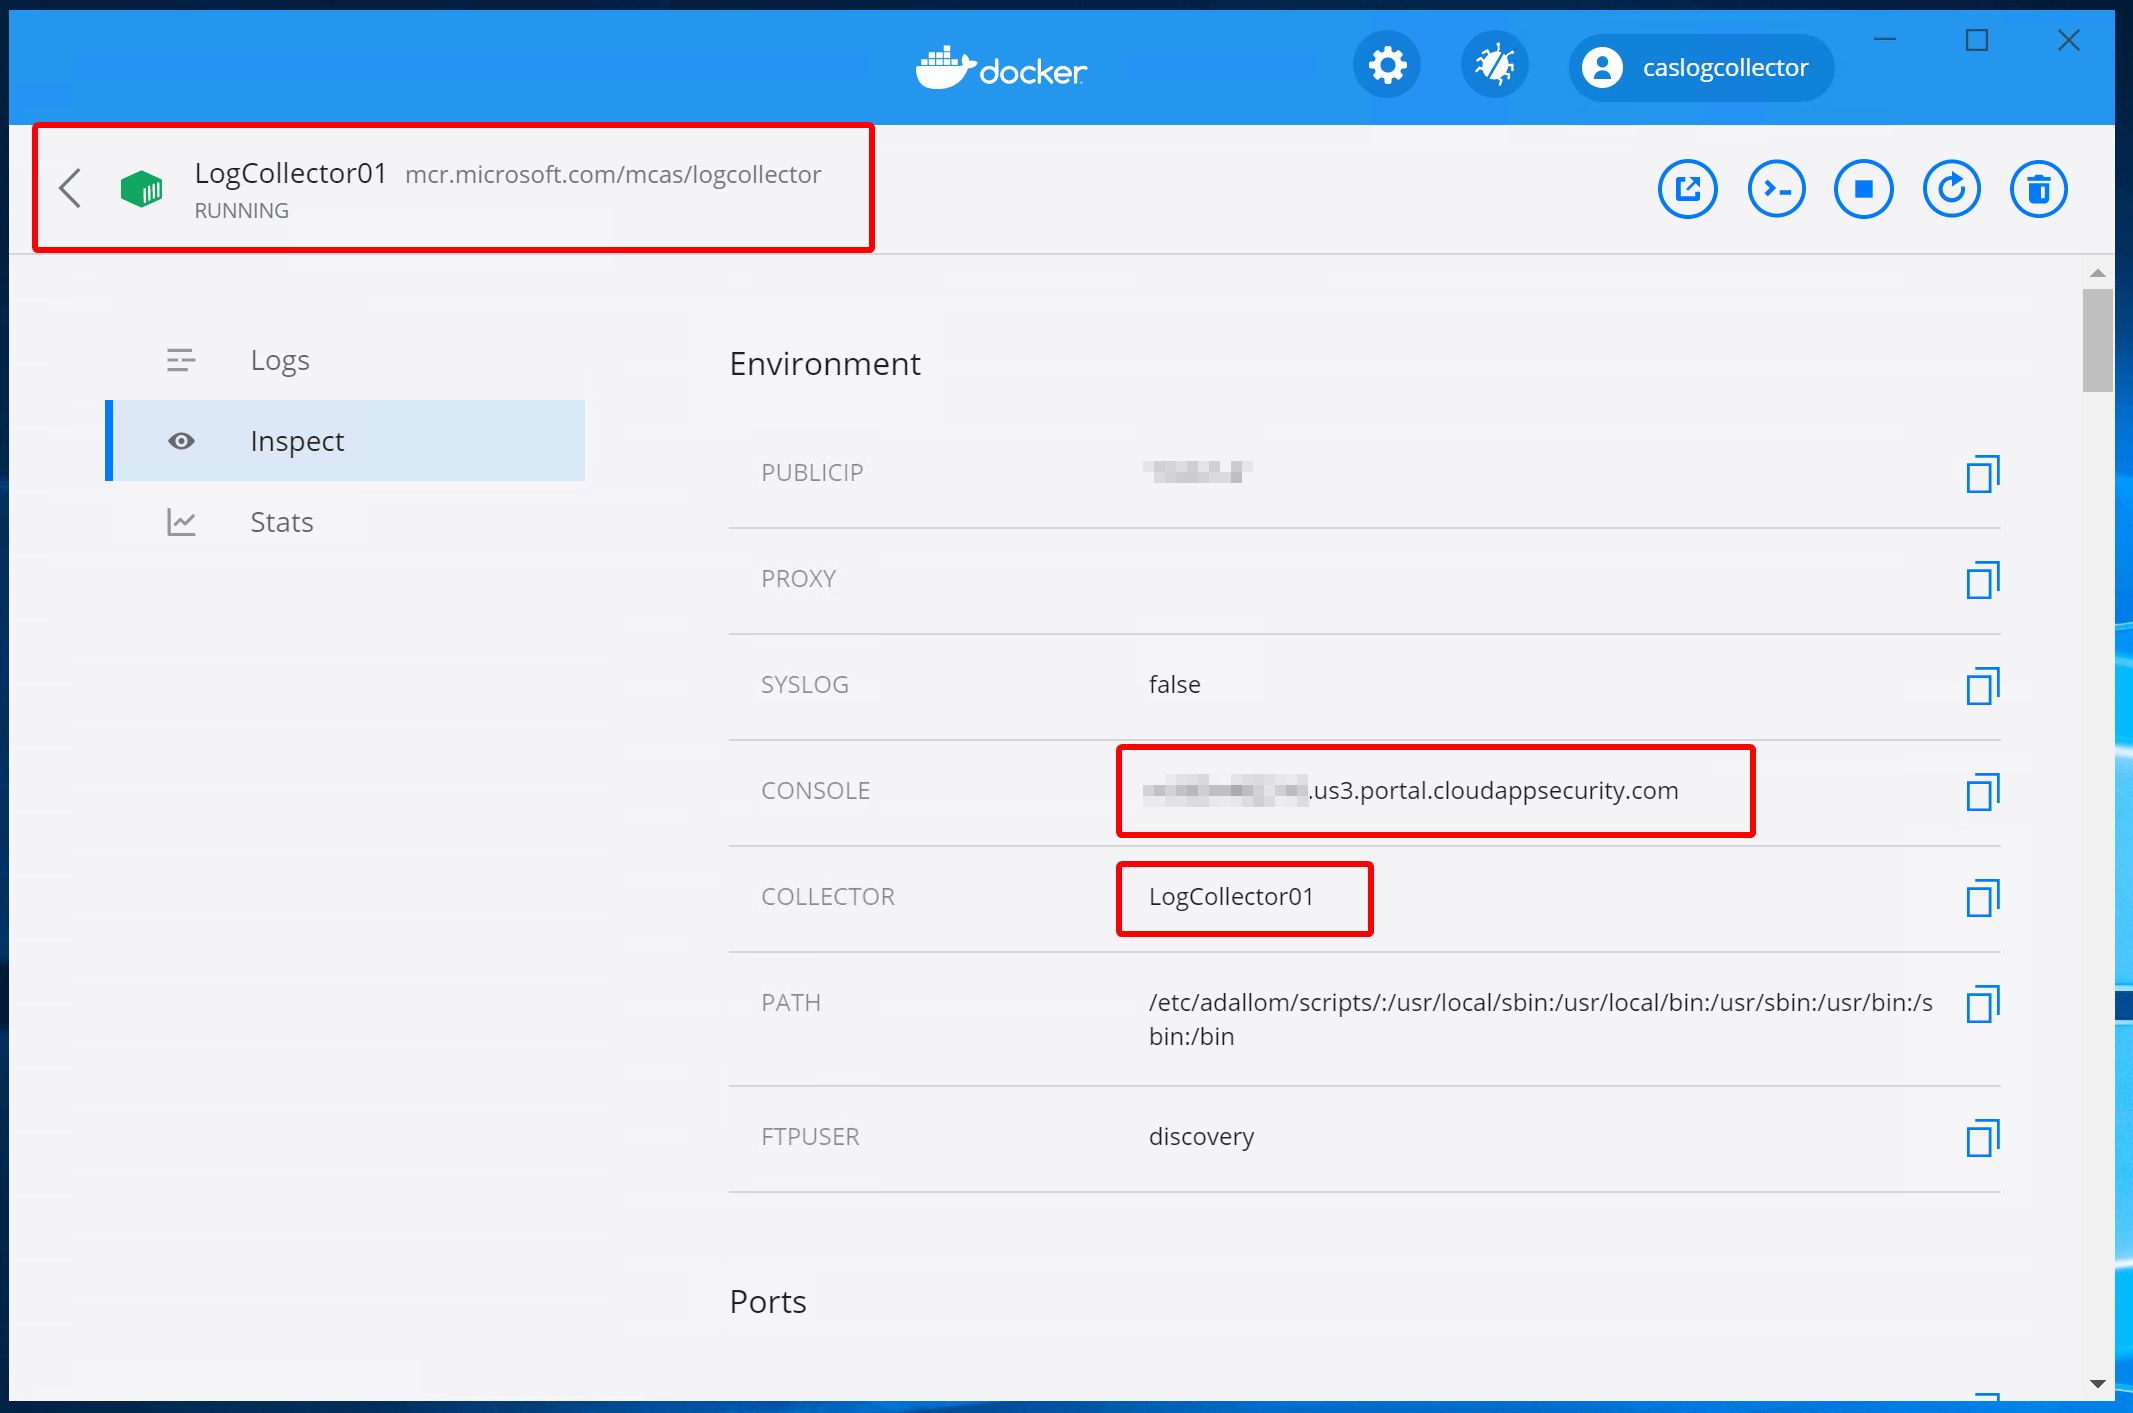
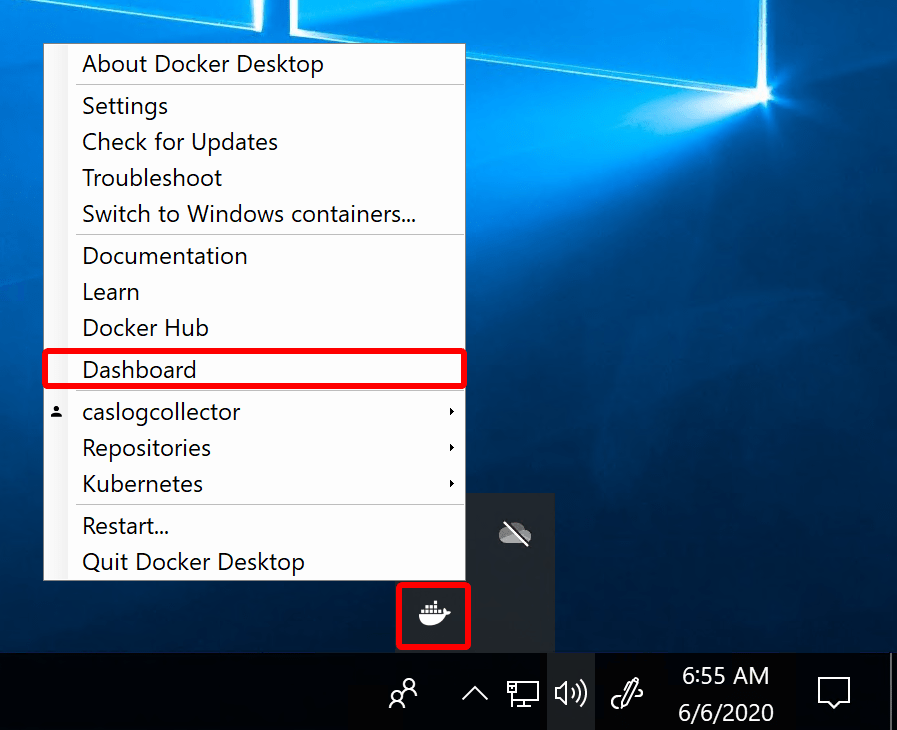
You can check the Docker Dashboard from the system tray. Check if the log collector is created.
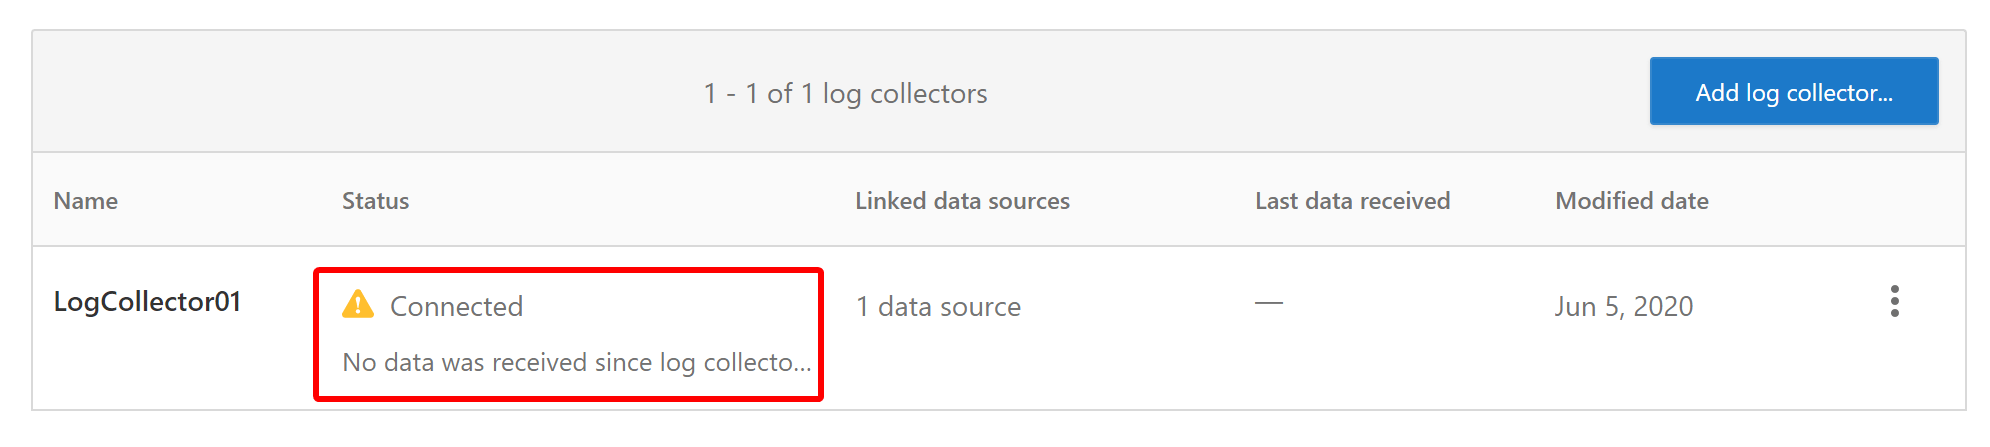
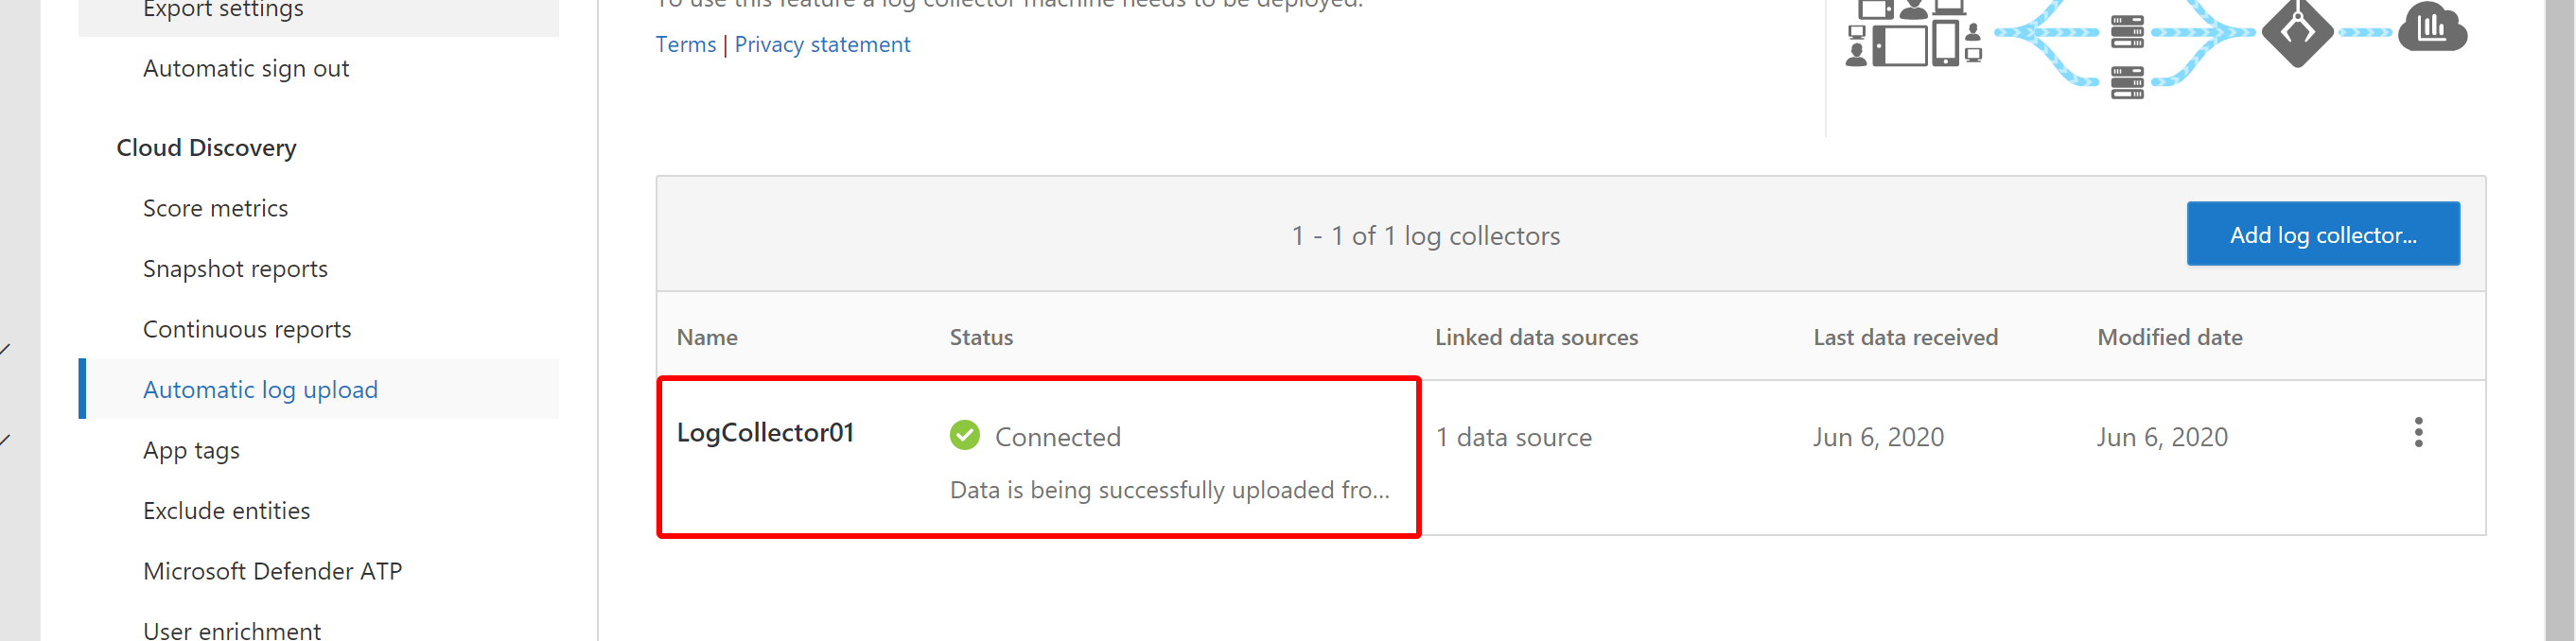
In the Cloud App Security portal, your Log Collector should be changed to “Connected”
Export logs to FTP server#
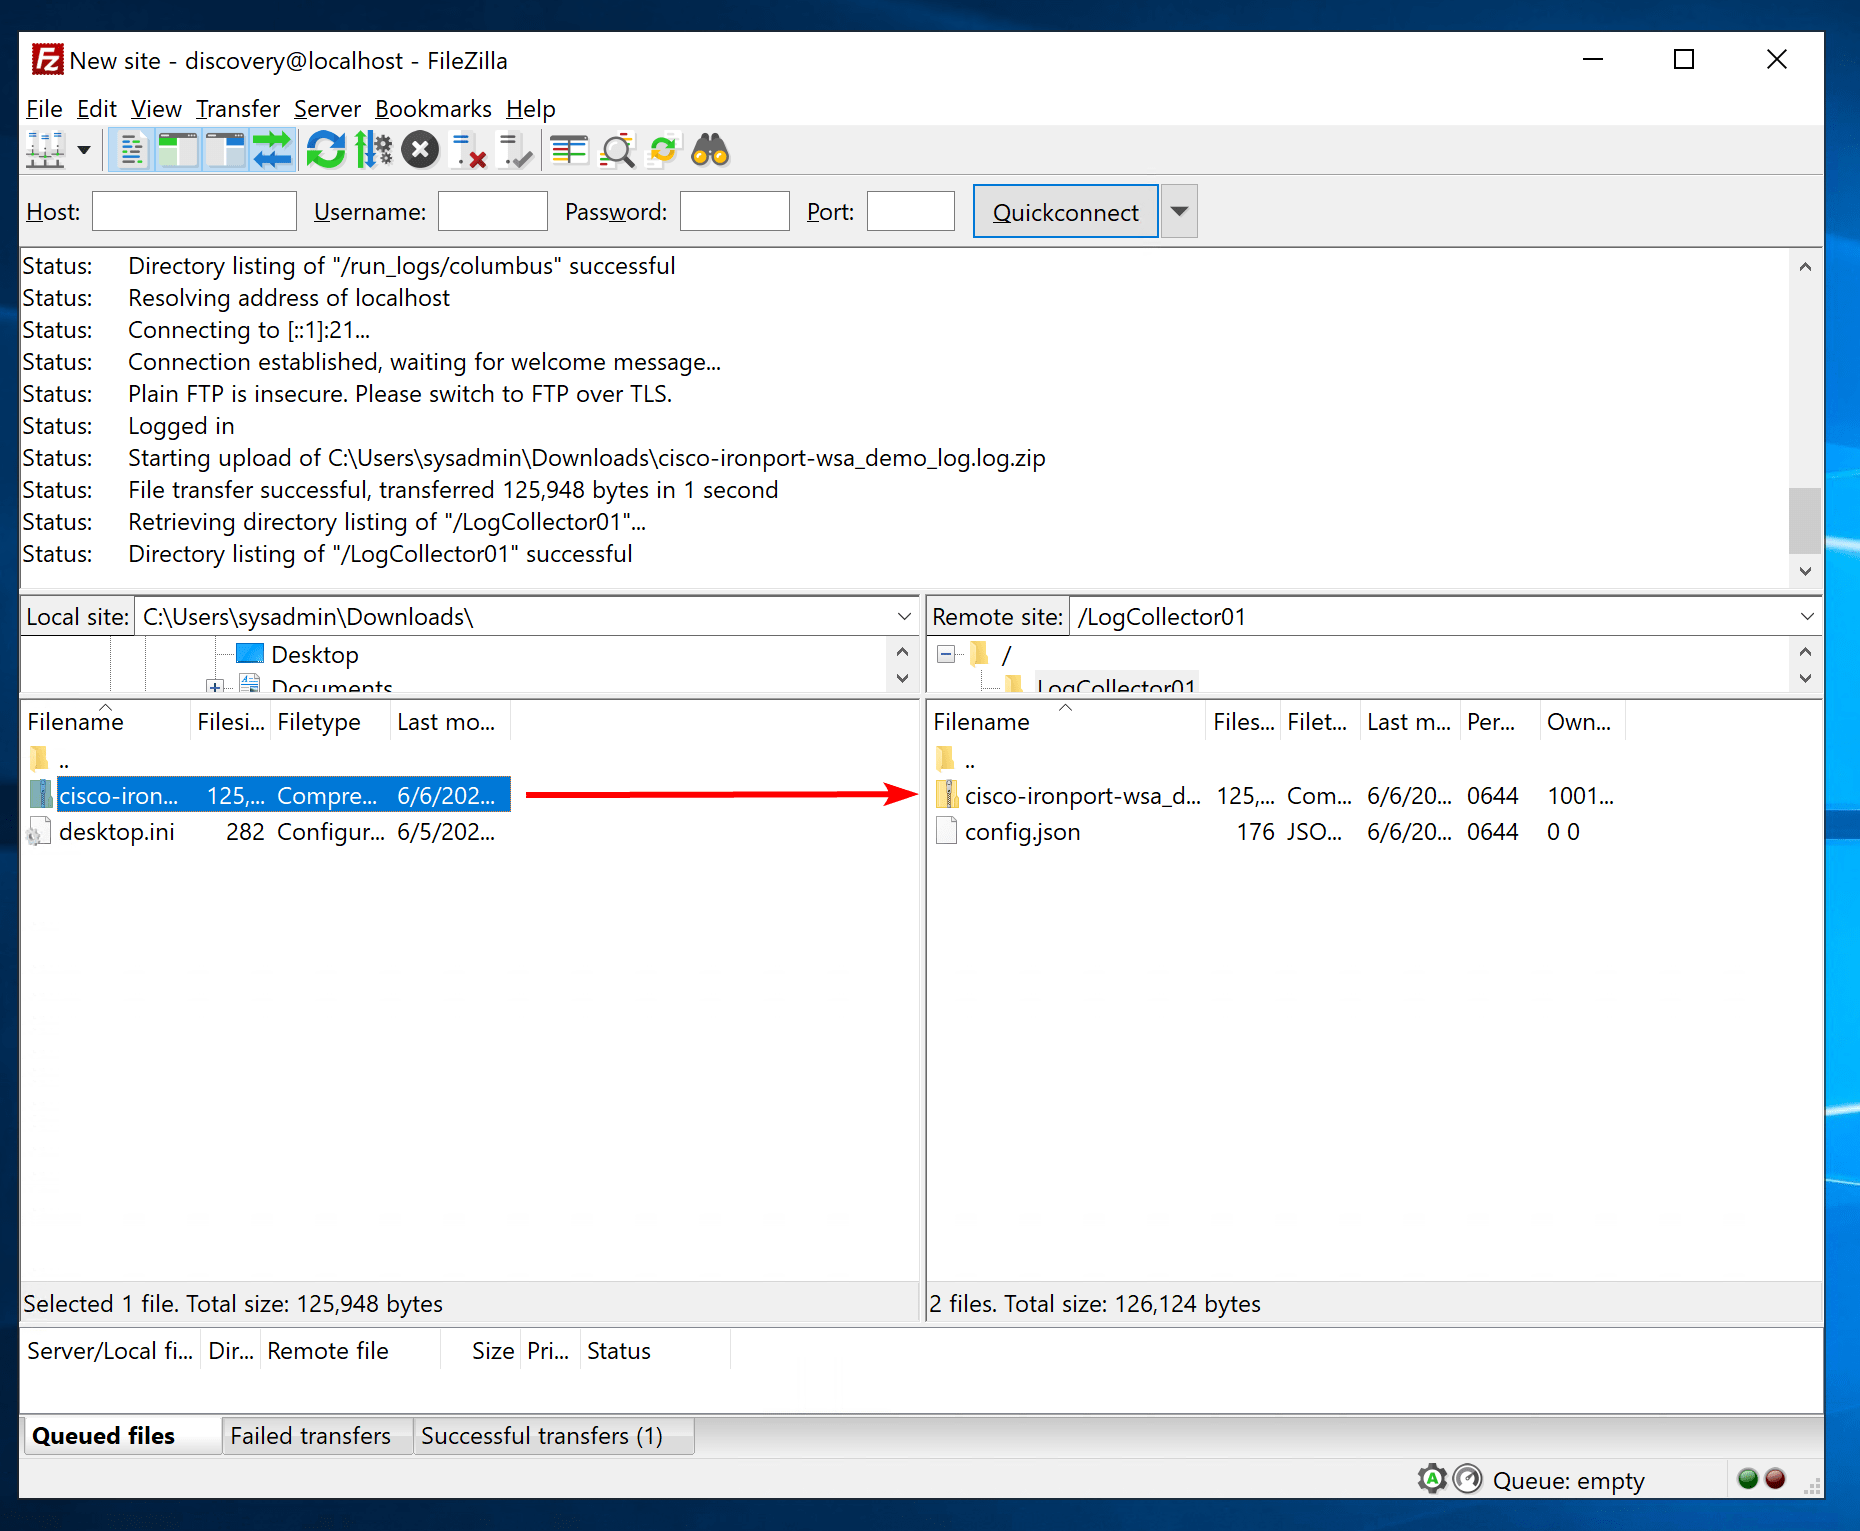
Now we got our Log Collector in place, we can configure our firewall to spit out log files to the FTP server. The configuration depends on what type of firewall or proxy you have. In this case, I’m working with the demo data from Cisco. I upload the log files manually to the FTP server to be picked up by MCAS. In reality, this should be a scheduled job. The file(s) need to be placed in the folder that represents your collector.
You can check the status in the Governance logs.
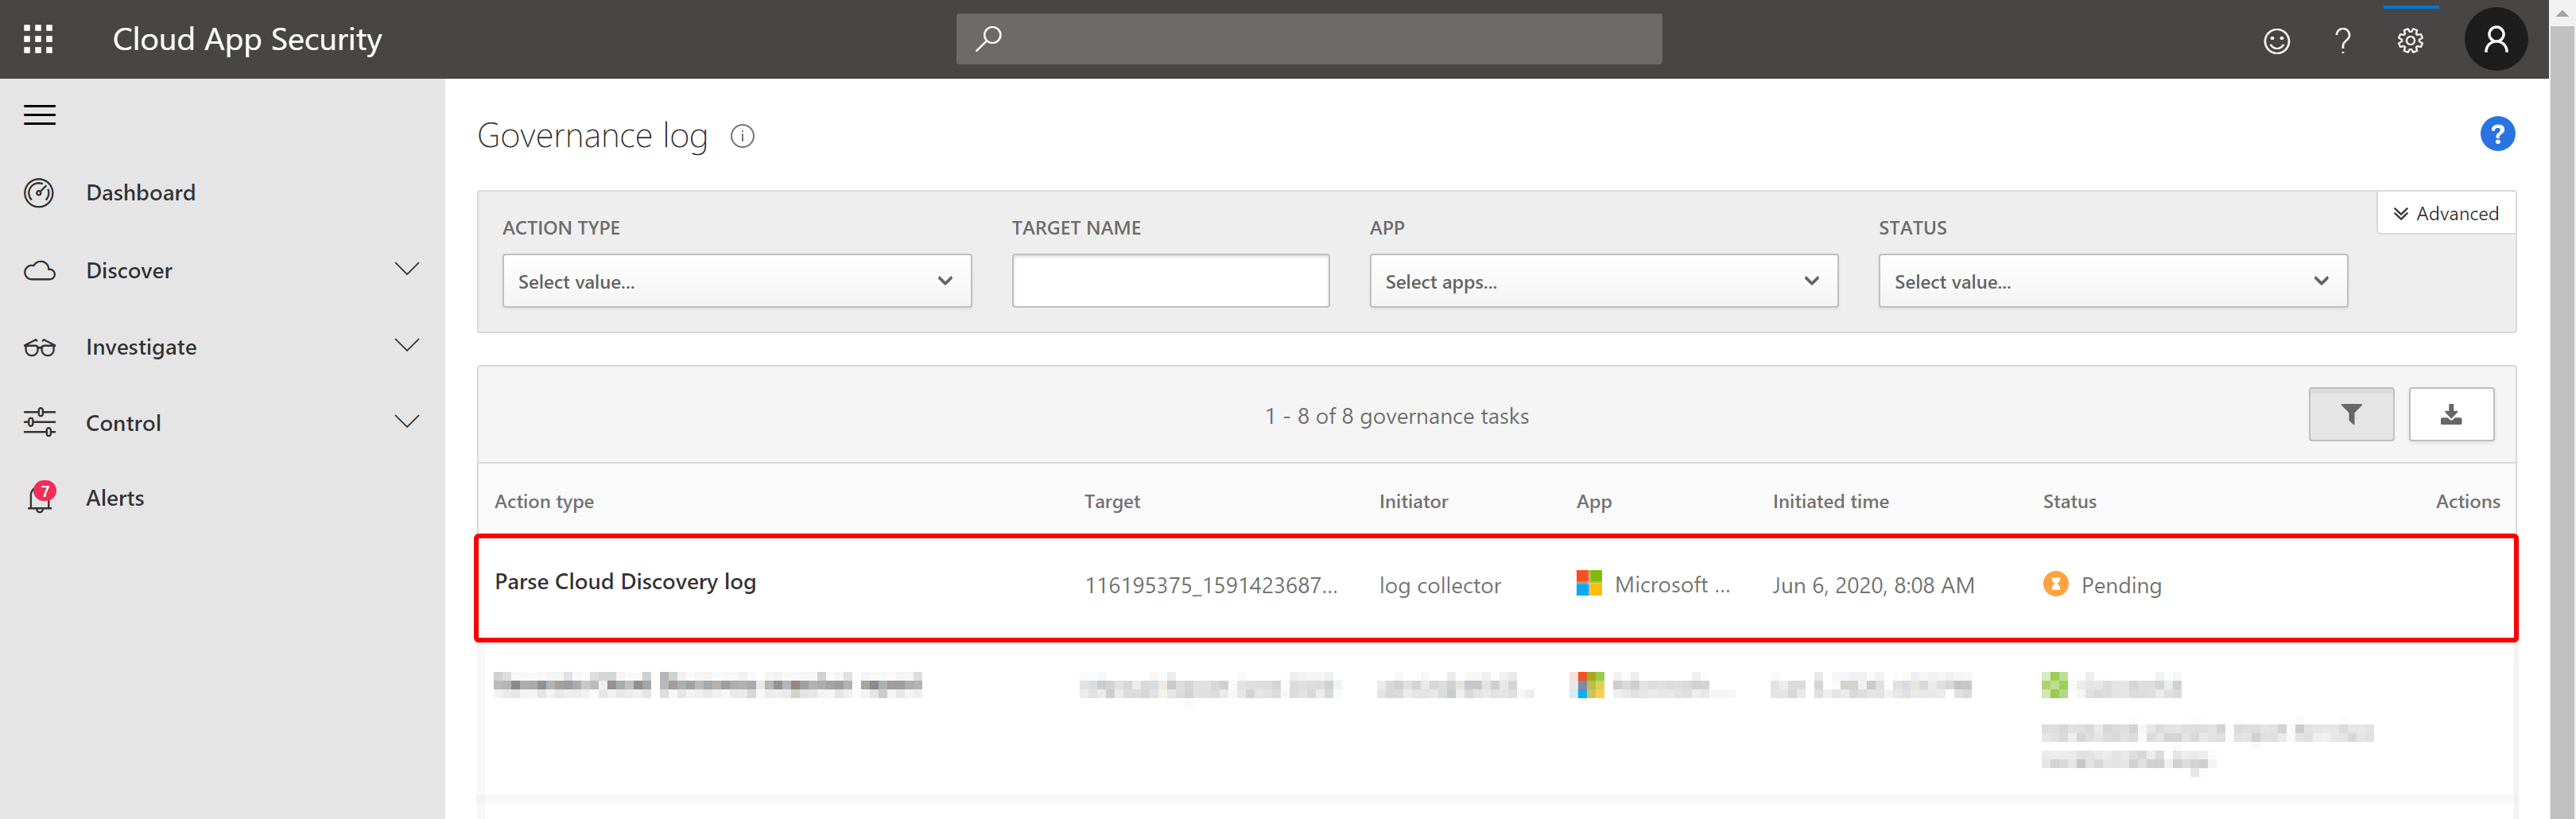

Once the file is parsed it is deleted from the FTP server directory. You can check your Collector status in the overview pane:
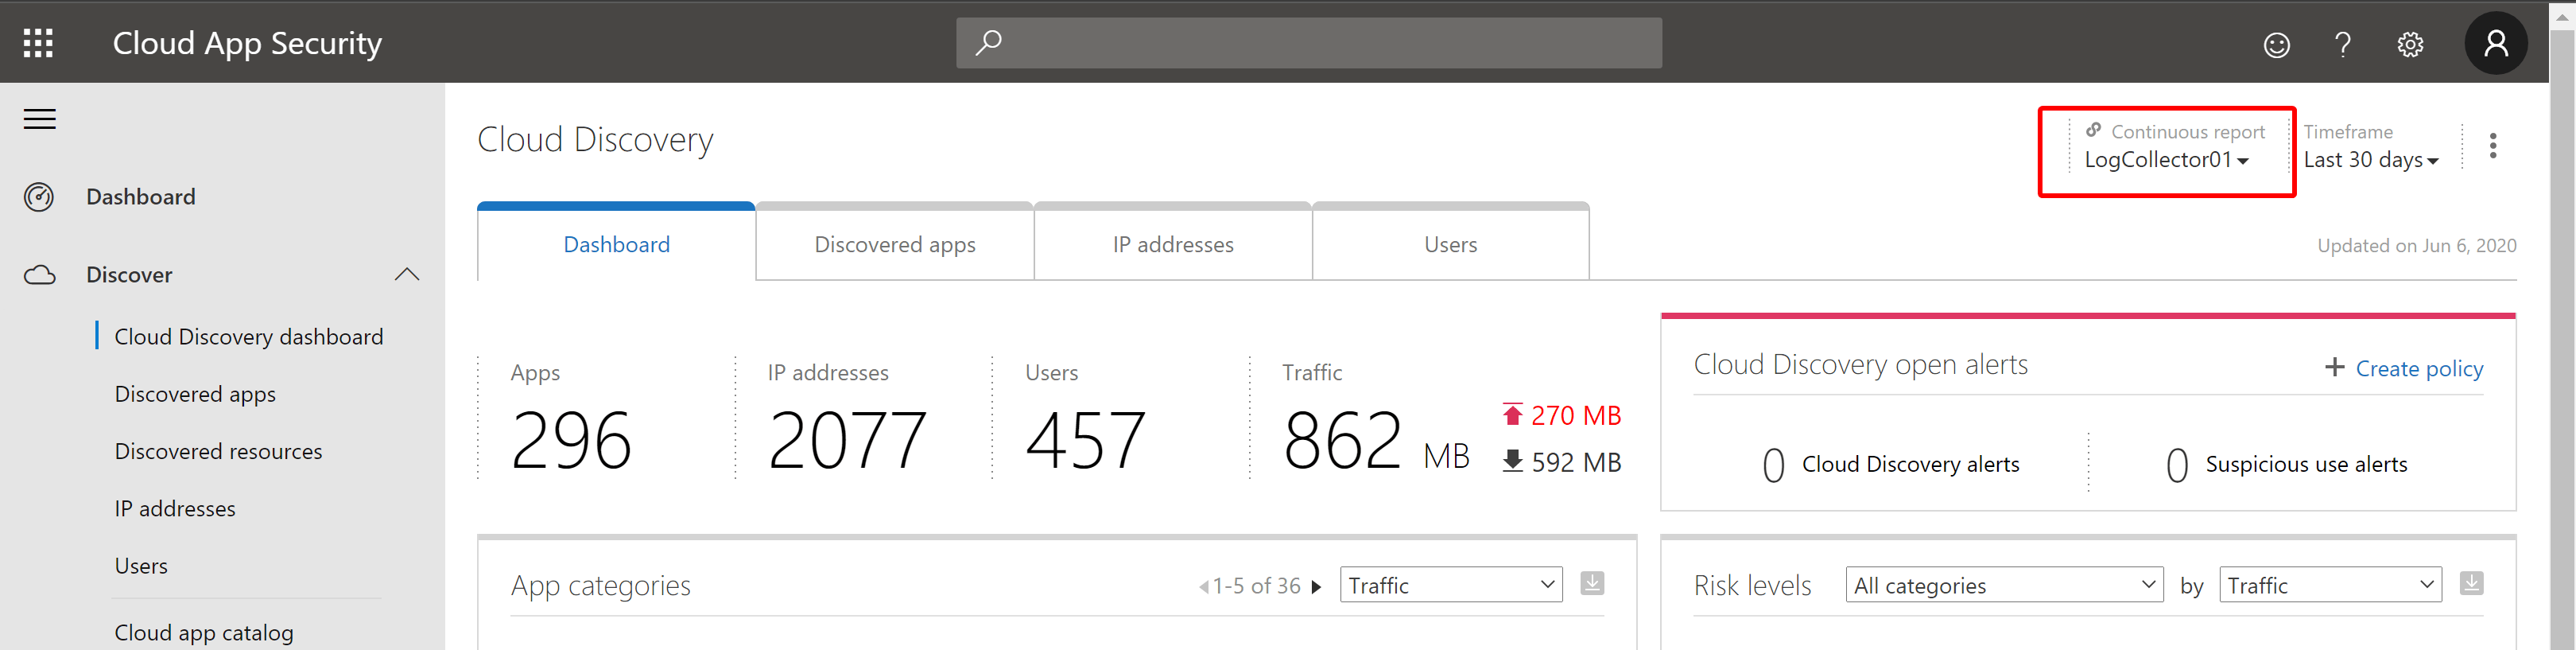
You can now select the Log Collector data in the Dashboard:
What’s next?#
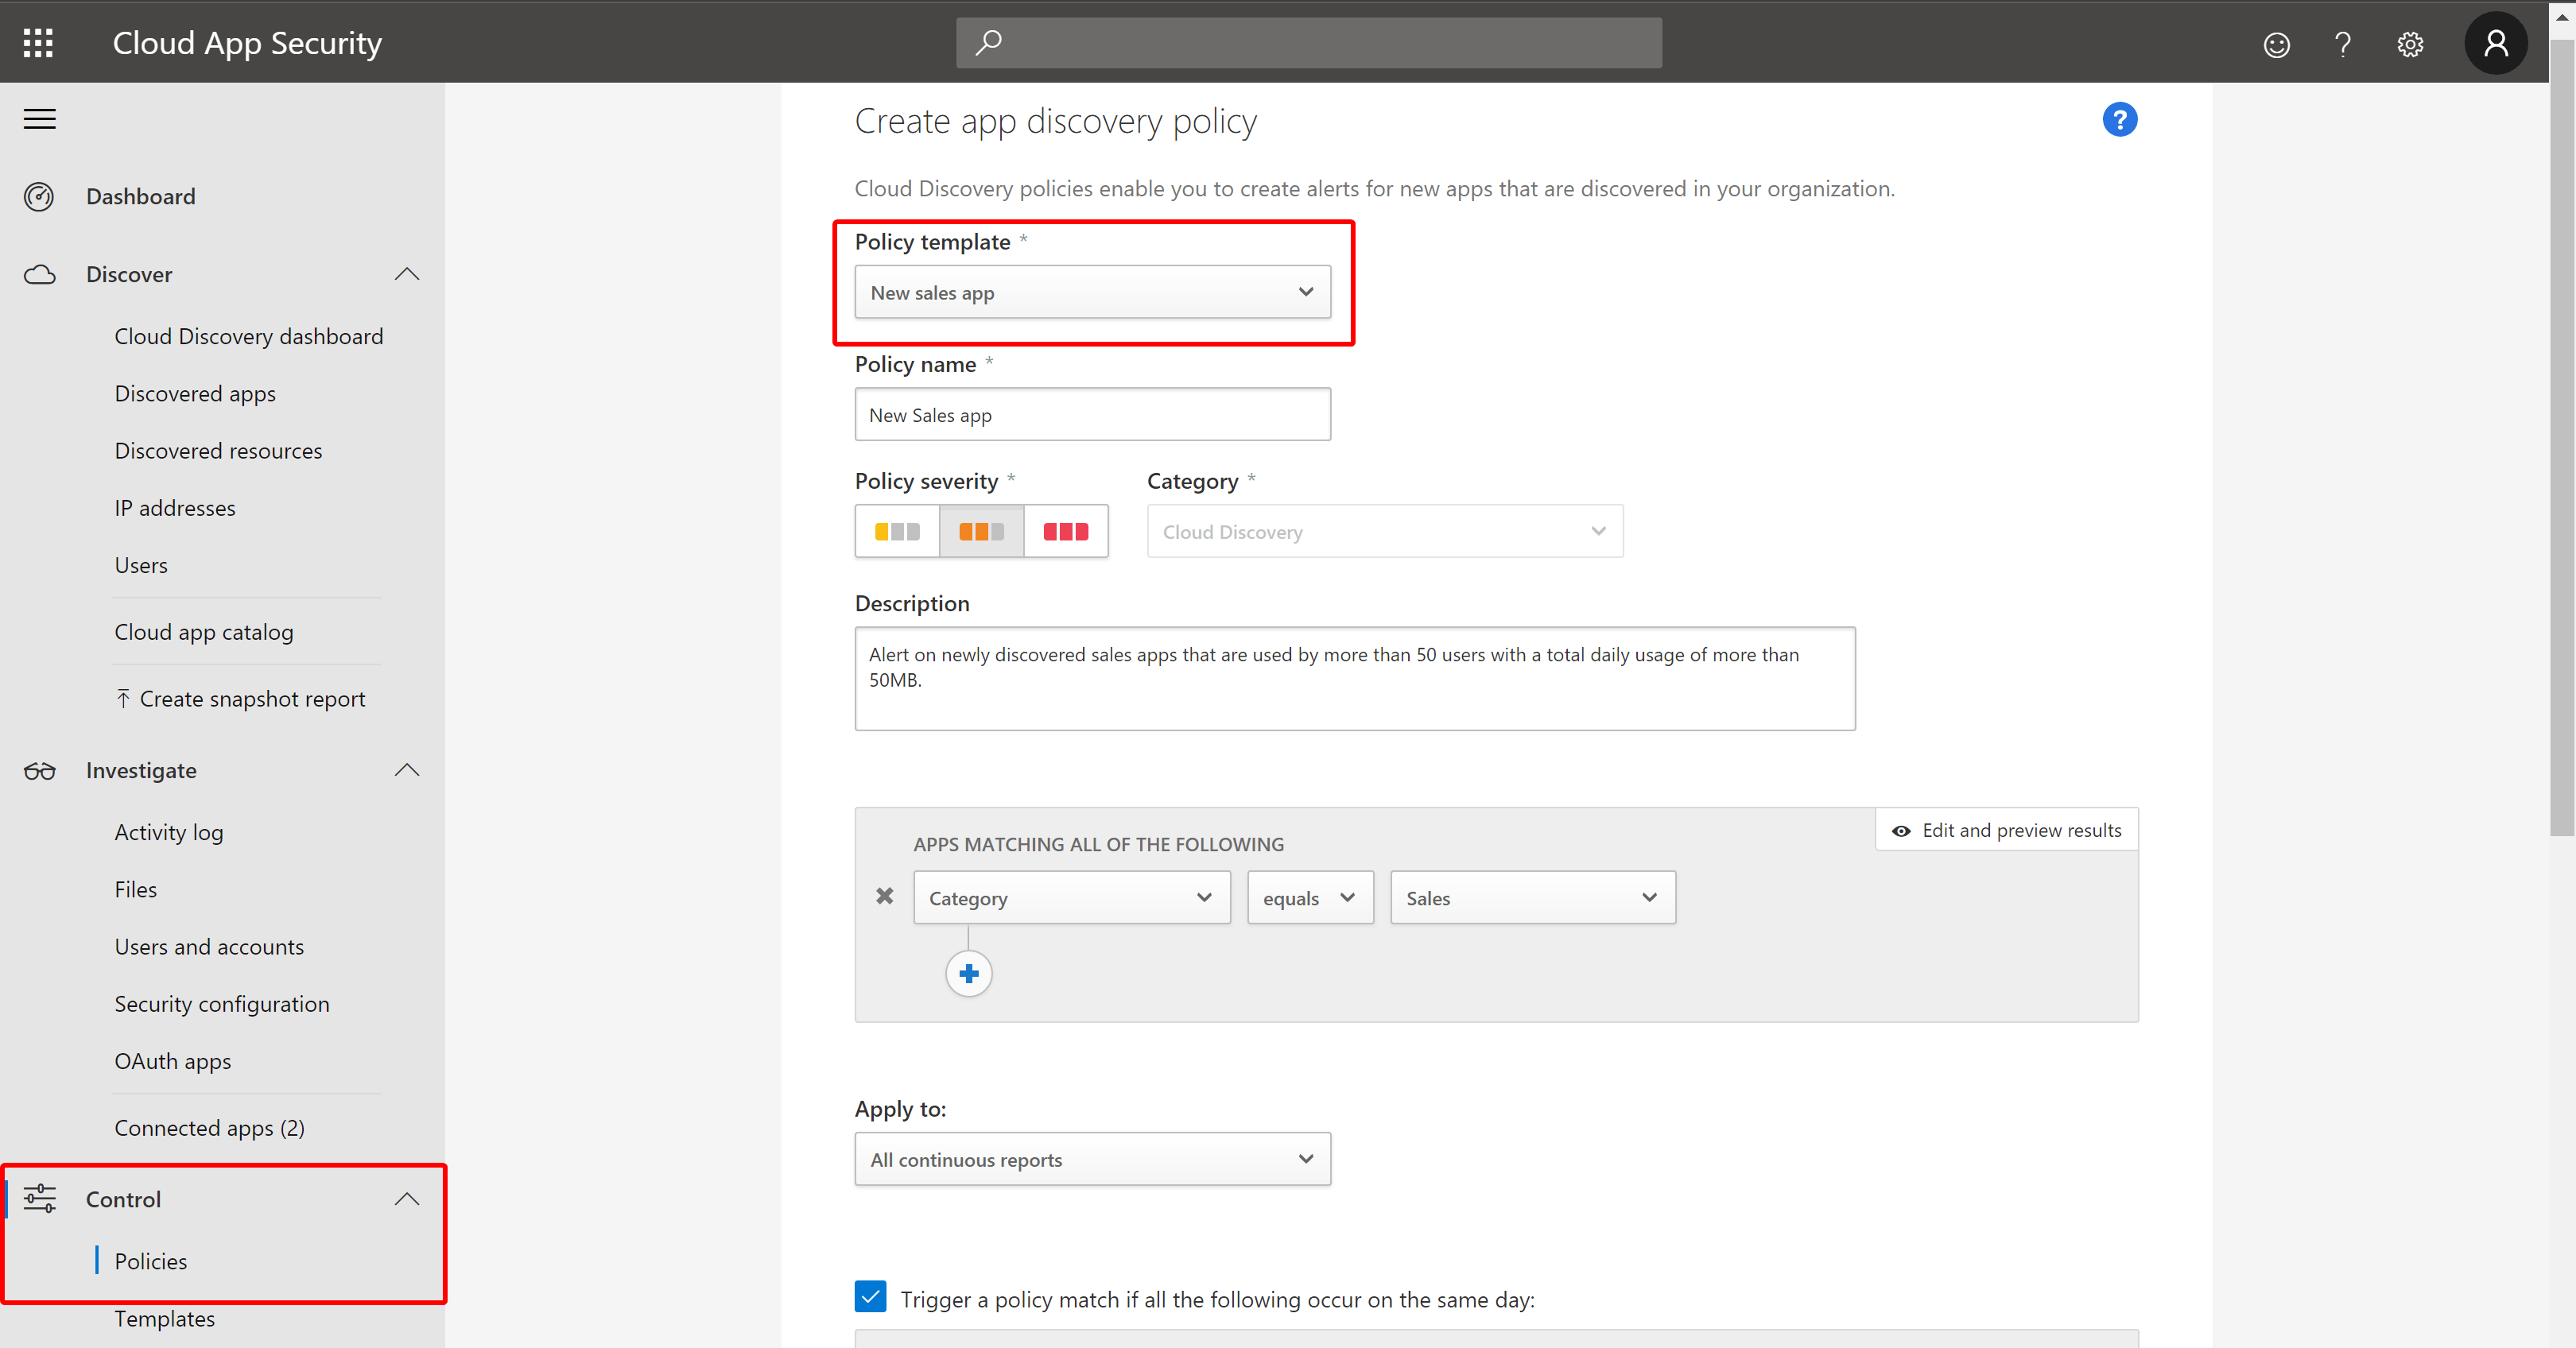
Now we have parsed our data into Cloud App Security, we have a lot of data to investigate. You can do this manually by going through the data manually, but it is recommended to setup app polices. There are a lot of templates to get you started. This way, you can be alerted when your users start using a new sales app for example. Shadow IT is a problem in any organization, and with the help of Cloud App Discovery, you’ll get great insights into the application usage of your users.
You can also set up Cloud Discovery anomaly polices to monitor suspicious behavior. From the Microsoft docs:
“Cloud App Security searches all the logs in your Cloud Discovery for anomalies. For instance, when a user, who never used Dropbox before, suddenly uploads 600 GB to it, or when there are a lot more transactions than usual on a particular app. The anomaly detection policy is enabled by default. It’s not necessary to configure a new policy for it to work. However, you can fine-tune which types of anomalies you want to be alerted about in the default policy.”
Let’s wrap up#
Cloud App Security is a great tool to discover shadow IT. It can be integrated with a lot of services and new features are added from time to time. To get you started, I suggest you take a look at the following sources:
- Microsoft Cloud App Security overview
- Tutorial: Discover and manage shadow IT in your network
- Set up Cloud Discovery
- Working with discovery data
Stay safe!
Comments
Comments load when you scroll here.